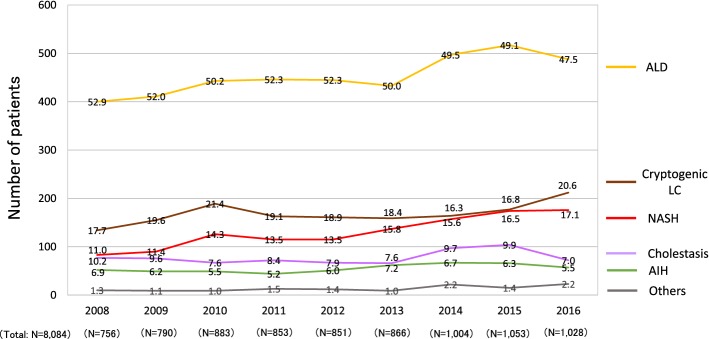
Fig. 7.
The transition in the number of patients who were diagnosed with non-viral LC. In agreement with the increase in the number of non-viral LC patients (Fig. 5), the complete sets of annual data from 36 hospitals revealed that the real numbers of patients newly diagnosed with alcoholic-related LC, NASH-related LC and cryptogenic LC were suggested to increase in 2008–2016. The percentages of the etiologies are shown in the graph bars

