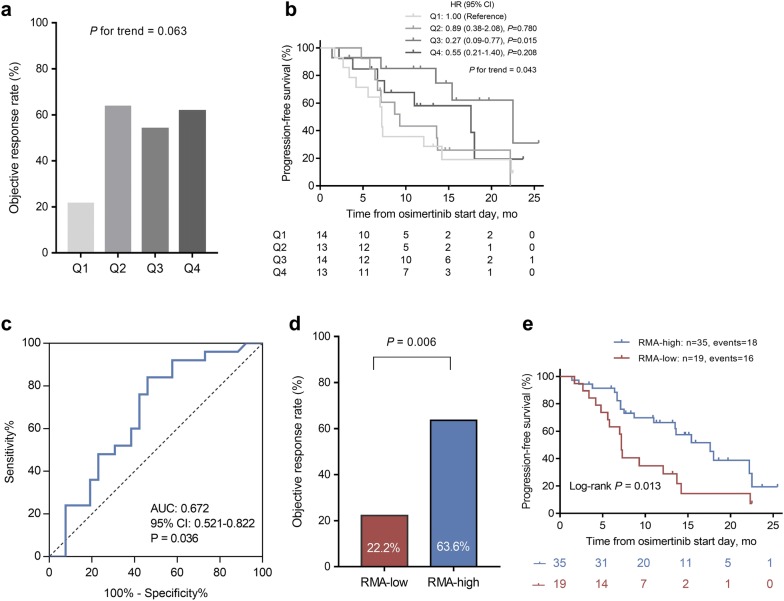
Fig. 5.
Correlation between T790M relative mutation abundance (RMA) and osimertinib treatment outcomes. a Objective response rate (ORR) stratified by T790M RMA quartiles (P for trend = 0.063). b Progression-free survival (PFS) stratified by T790M RMA quartiles (P for trend = 0.043). c Receiver Operating Characteristic (ROC) Curve and area under ROC curve for T790M RMA predicting objective response. d ORR stratified by RMA-low and RMA-high patients (22.2% vs 63.6%, P = 0.006). e PFS stratified by RMA-low and RMA-high patients (P = 0.013, log-rank test)

