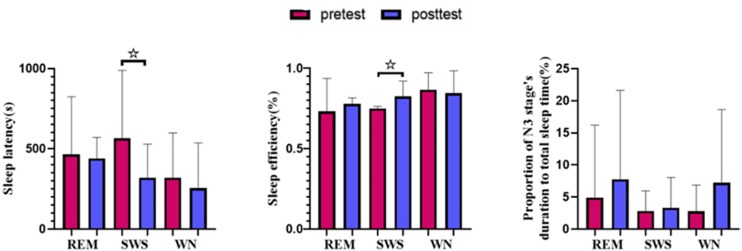
FIGURE 5.
Sleep variables from polysomnography (PSG). The sleep latency in the SWS group decreased significantly [t(10) = 2.441, p = 0.031] after listening to music, and the sleep efficiency in the SWS group increased significantly [t(10) = −1.943, p = 0.076]. * means there is a significant difference or a marginally significant difference between two groups.

