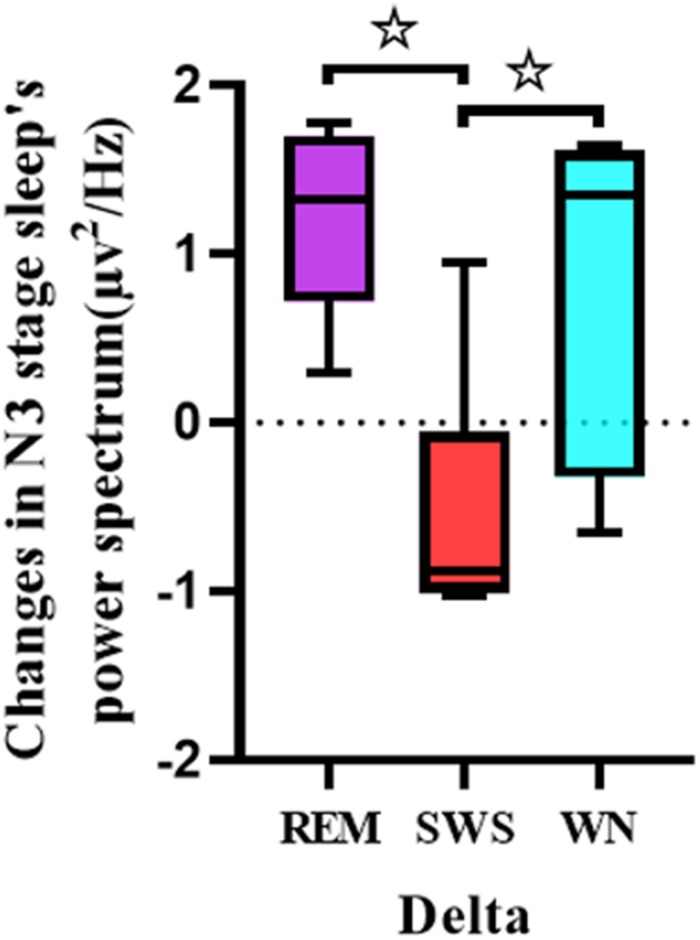
FIGURE 6.
Comparison of each group’s whole brain power spectral density in the delta band of the EEG during the deep sleep stage (posttest – pretest). For the delta band of the EEG, there was a significant difference between the REM group and the SWS group (p = 0.005) and between the SWS group and the WN group (p = 0.024). * means there is a significant difference or a marginally significant difference between two groups.

