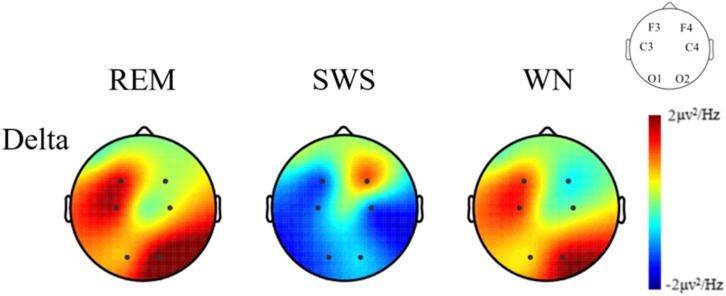
FIGURE 7.
The EEG power spectral density topographic maps of the deep sleep stage for the REM, SWS, and WN groups in the delta band, respectively (posttest – pretest). In the REM group and the WN group, the power spectral density at the F4 and C4 channels did not change after music listening. The power spectral density at the O1, C3, F3, and O2 channels all increased after music listening, of which the O1 channel increased the least and O2 increased the most. In the SWS group, the power spectral density at the F4 channel did not change, and the power spectral density at the F3, C3, C4, O1, and O2 channels decreased after the experiment, with the C4 channel decreasing the most. The power spectral density increased in F4 but decreased in other channels in the SWS group.

