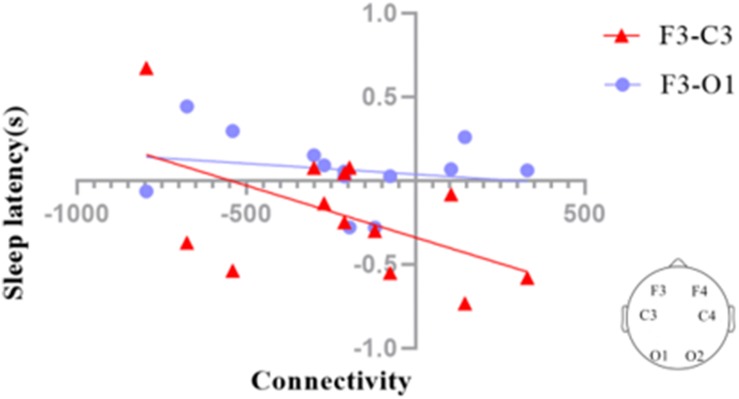
FIGURE 8.
Correlation coefficients between the EEG connectivities of the deep sleep stage and sleep latency in the SWS group (posttest – pretest). The connectivity between F3 and C3 (F3–C3) during deep sleep was marginally significantly correlated (p = 0.064) with sleep latency (red triangles), while the connectivity between F3 and O1 (F3–O1) during deep sleep was not significantly correlated with sleep latency (blue dots).

