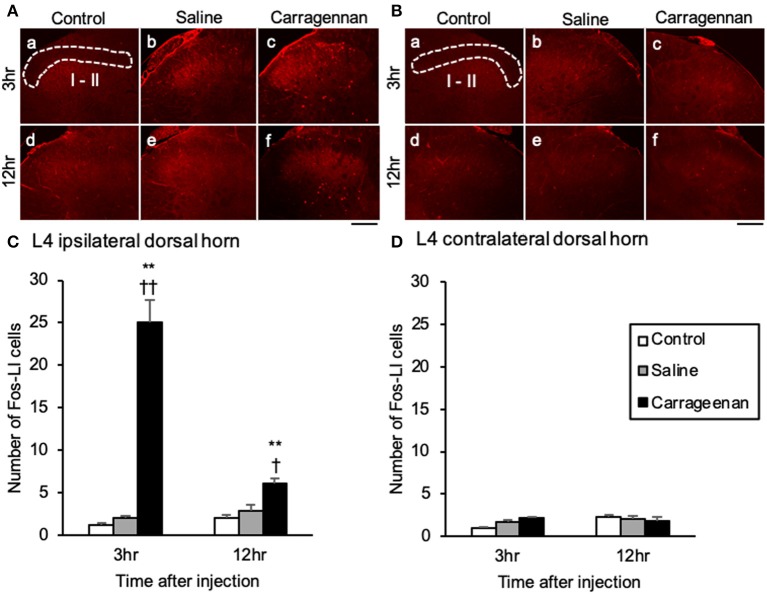
Figure 2.
Expression of Fos-immunoreactive cells in lamina I and II of lumbar segment 4 dorsal horn after intra-articular injection. Fos-immunoreactive (ir) cells (red) in the ipsilateral lamina I and II (A) and contralateral side (B) are shown (n = 5–6 per group). Scale bars = 100 μm. The ipsilateral and contralateral lamina I and II are surrounded by white dotted lines (A-a, B-a). Numbers of Fos-ir cells in the ipsilateral lamina I and II (C) and contralateral side (D) are shown. The data are presented as mean ± standard error of the mean (two-way ANOVA). **P < 0.01 compared to control. †P < 0.05 and ††P < 0.01 compared to saline.

