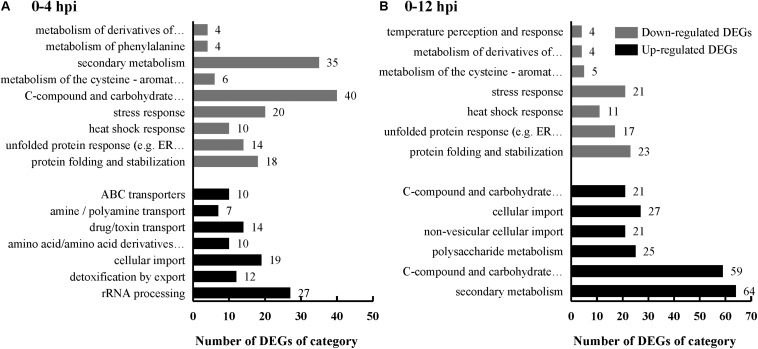
FIGURE 3.
FunCat category enrichment of S. sclerotiorum DEGs induced by C. minitans. Genes were analysized according to the web-based FungiFun2 database against genome of S. sclerotiorum. X-axis represents the DEG number of a functional category. Black bars represent the up-regulated DEGs and gray bars represent the down-regulated DEGs. (A) S. sclerotiorum DEGs in 0–4 hpi. (B) S. sclerotiorum DEGs in 0–12 hpi. The detailed information was shown in Supplementary Table S3.

