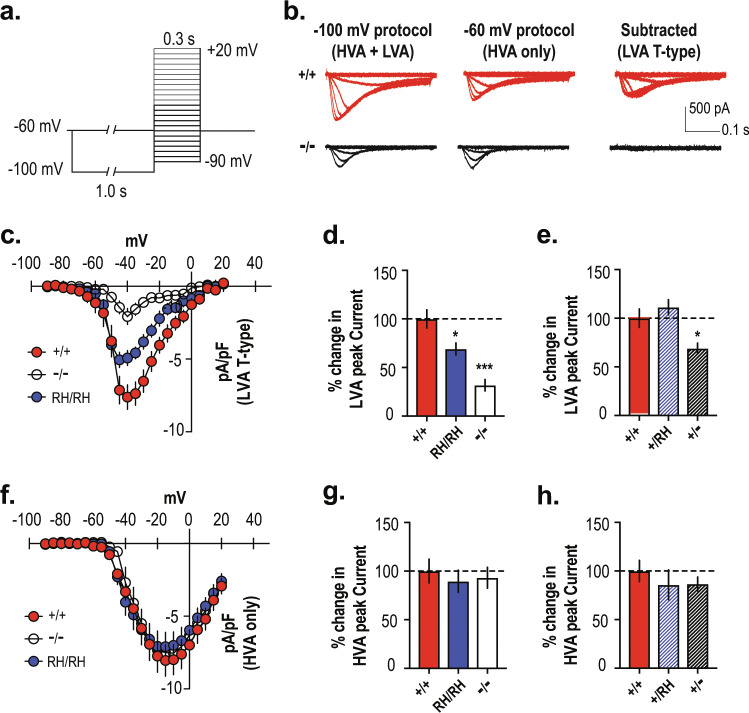
Fig. 2. Reduction of T-type Ca2+ current in the Cacna1iRH/RH and Cacna1i−/− TRN neurons.
a Protocol isolating T-type Ca2+ current in TRN neurons. Low-voltage-activated (LVA) together with high-voltage-activated (HVA) inward currents were elicited in neurons from a holding potential of −100 mV (for 1 s) to depolarizing test potentials ranging from −90 to +20 mV (Δ5 mV), in the presence of K+ and Na+ channel blockers AP-4 and TTX, respectively. HVA only inward currents were measured using the same protocol but from a holding potential of −60 mV. T-type Ca2+ currents from the TRN neurons were then isolated offline, by subtracting the HVA only inward current traces from the ones obtained from the HVA + LVA protocol. b Sample traces from Cacna1i+/+ and Cacna1i−/− animals for voltage steps from −90 to −30 mV are shown for holding potentials at −100 and −60 mV, respectively, as well as the subtracted T-currents. While a significant amount of T-type Ca2+ current can be obtained after the subtraction method in the Cacna1i+/+ neuron, there was a complete lack of subtracted T-type currents in the Cacna1i−/− neuron, validating the assay for T-type Ca2+ current isolation from mouse TRN neurons. c Mean current–voltage relationships (I–V) constructed for the subtracted T-type Ca2+ current density for Cacna1i+/+, Cacna1iRH/RH, and Cacna1i−/− TRN neurons, showing a dramatic reduction in T-type Ca2+ current in the Cacna1i−/− mice and a moderate reduction in peak current density in the Cacna1iRH/RH mice. d, e Percent change in peak current density for T-type Ca2+ current is plotted from the homozygous (d; p < 0.0001; R2 = 0.563; F (2,32) = 2.181; one-way ANOVA) and heterozygous (e; p = 0.0027; R2 = 0.39; F (2,24) = 1.882; one-way ANOVA) TRN neurons, compared to Cacna1i+/+. f Mean I–V constructed for the HVA only Ca2+ current for Cacna1i+/+, Cacna1iRH/RH, and Cacna1i−/− TRN neurons. g, h Percent change in HVA only Ca2+ current calculated for the homozygous (g; p = 0.80; R2 = 0.013; F (2,34) = 0.1574; one-way ANOVA) and heterozygous (h; p = 0.58; R2 = 0.0448; F (2,24) = 0.7681; one-way ANOVA) genotypes shows no significant differences in HVA Ca2+ current among the TRN neurons of all genotypes. *p < 0.05; ***p < 0.001; error bars represent S.E.M. All mean values and detailed statistics are listed in Supplementary Table 1.

