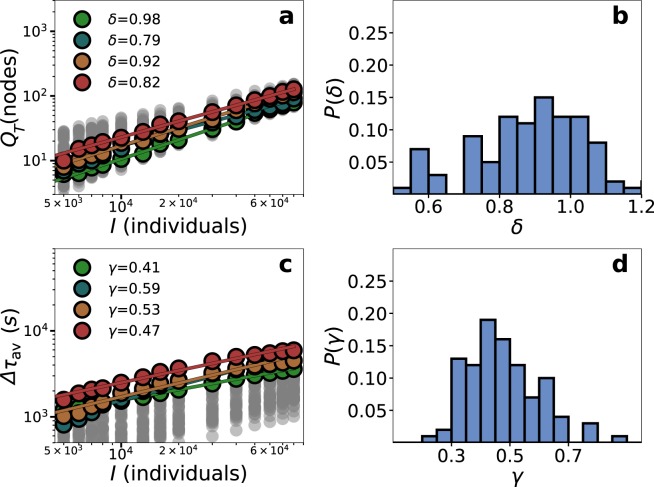
Figure 6.
Scaling for the event individuals in Paris. (a) Congested nodes as a function of . A stop is considered congested if the queue is higher than its capacity at any moment of the simulations. (b) Distribution of the exponents of the scaling of congested nodes. (c) Average delay vs . (d) Distribution of the exponents of the scaling of the average delay. Simulations are performed in locations selected at random uniformly within the city boundaries delimited by the transportation networks. In color, we show four locations as highlights and the rest in grey. Simulations were performed with .

