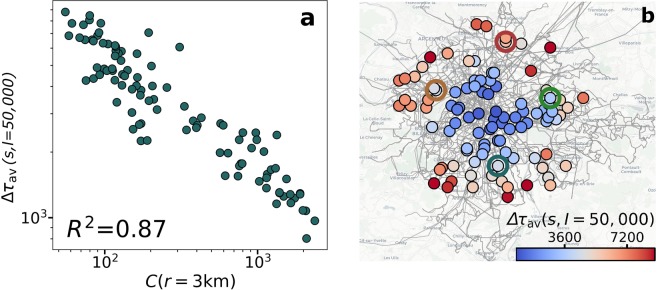
Figure 8.
Spatial distribution of delays. (a) for an event of 50,000 individuals as a function of the total capacity within a radius of 3 km. (b) Map of the average delay in seconds for an event of 50,000 individuals in the same 100 locations studied in Figs. 6 and 7. The empty circles in the map mark the four locations highlighted in the previous figures. The underground map layout is produced using Carto. Map tiles by Carto, under CC BY 3.0. Data by OpenStreetMap, under ODbL.

