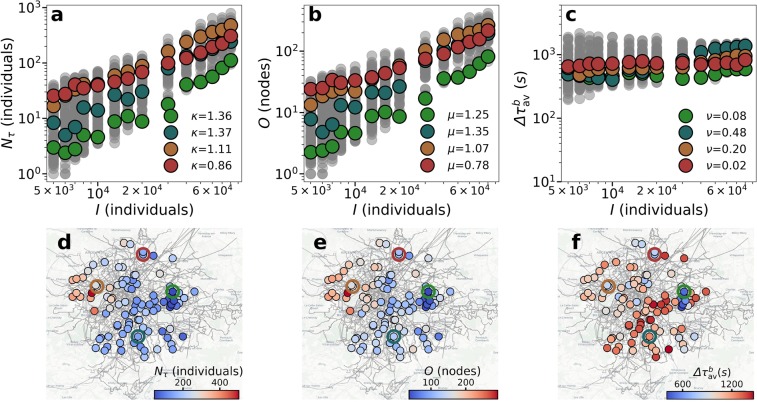
Figure 9.
Scaling for the background individuals in Paris. Scaling of the (a) delayed individuals, (b) origins affected and (c) average delay with the number event individuals. Map of the (d) delayed individuals, (e) origins affected and (f) average delay for an event of individuals. The empty circles in the maps mark the locations of the scaling shown in color in (a–c). Simulations were performed in the same 100 locations studied in previous figures. The underground map layout is produced using Carto. Map tiles by Carto, under CC BY 3.0. Data by OpenStreetMap, under ODbL.

