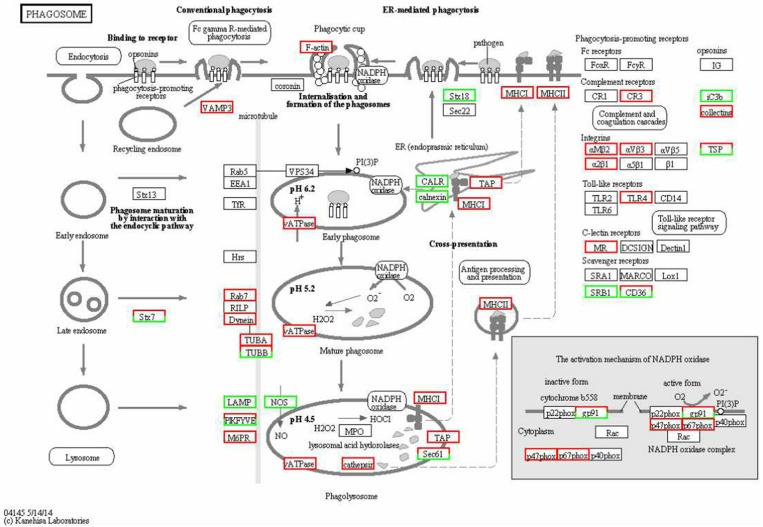
Figure 5.
KEGG functional annotation of differentially expressed genes (DEGs) involved in the cell phagosome pathway. A red rectangle denotes that the DEGs are significantly up-regulated [log fold change > 1, false discovery rate (FDR) < 0.001]; A green rectangle denotes that the DEGs are significantly down-regulated (log fold change > 1, FDR < 0.001) in the FAdV-4-infected liver, compared with the control liver.

