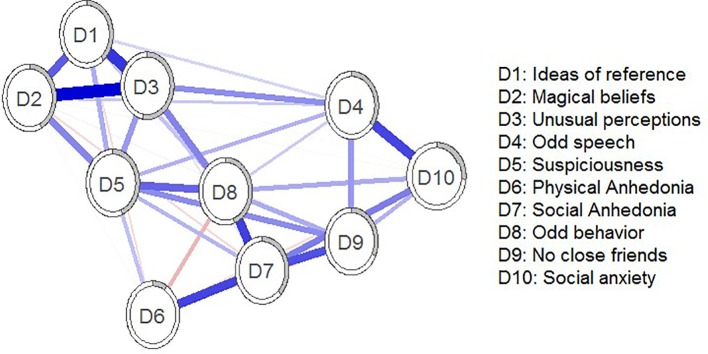
Figure 1.
Estimated schizotypy network. Blue edges represent positive associations; red edges represent negative associations. Thickness and saturation of edges indicate the strength of associations. The filled part of the circle around each node shows the predictability of each node, representing the variance of the nodes explained by all nodes with which it is connected.

