Figure 1.
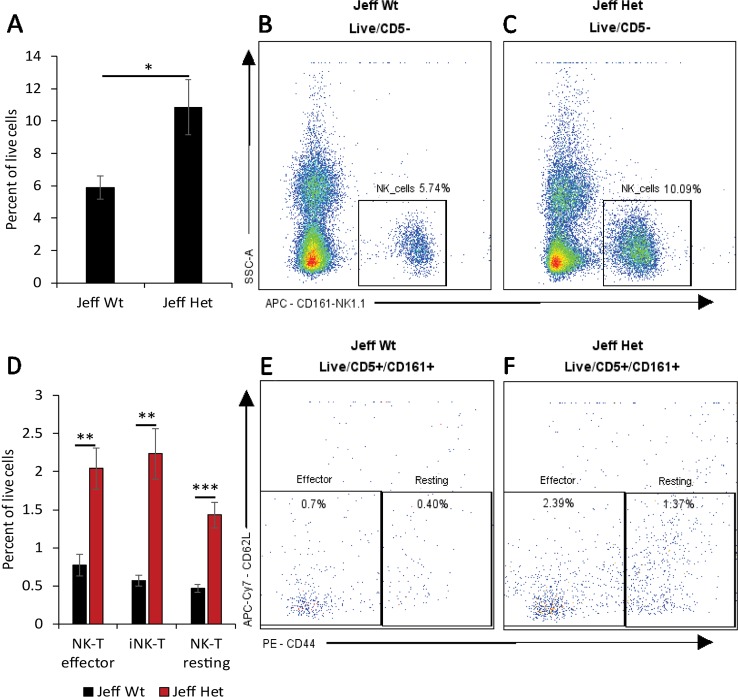
Natural killer (NK) cell percentage in Jeff mice (Fbxo11Jf/+ and Jeff Wt). (A) Average difference in the percentage of blood NK cells in Jeff Het (Fbxo11Jf/+) and Jeff wild type (Jeff Wt) mice. The error bars show standard error of mean where n = 4 and *P < 0.05. Representative flow cytometry plot for NK cell analysis of bloods from Jeff Wt (B) and Jeff Het (Fbxo11Jf/+) (C) mice. (D) Average difference in the percentage of blood effector NKT, resting NKT, and invariant NKT (iNKT) cells in Jeff Het (Fbxo11Jf/+) and Jeff Wt mice. The error bars show standard error of mean where n = 4 and *P < 0.05, **P < 0.01, ***P < 0.001. Representative flow cytometry plot for NKT cell analysis of bloods from Jeff Wt (E) and Jeff Het (Fbxo11Jf/+) (F) mice.

