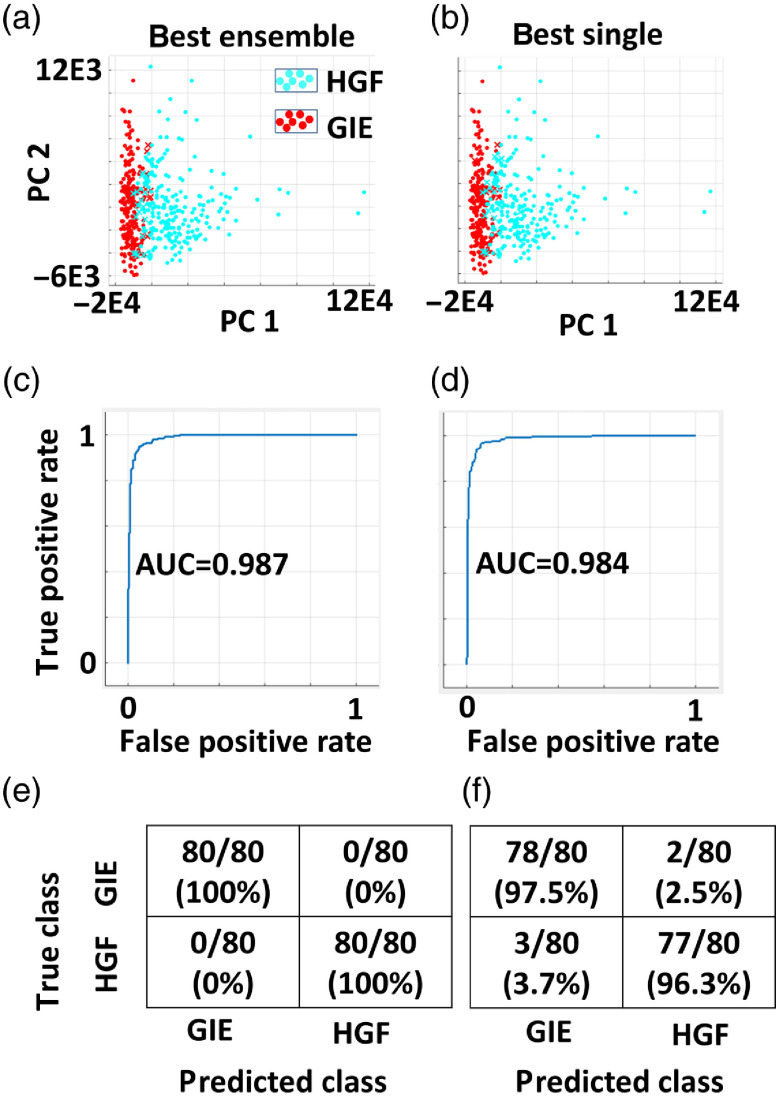
Fig. 4.
Binary classifier training data (a) and (b) scatterplots of PC 1 versus 2, highlighting correctly classified GIE (red circle) and HGF (cyan circle) cells, and misclassified cells (red and cyan x’s, with color representing the true class). (c) and (d) ROC curves from training data, with AUC listed. (e) and (f) Error tables from a test dataset for (e) Bagged Trees and (f) linear SVM.

