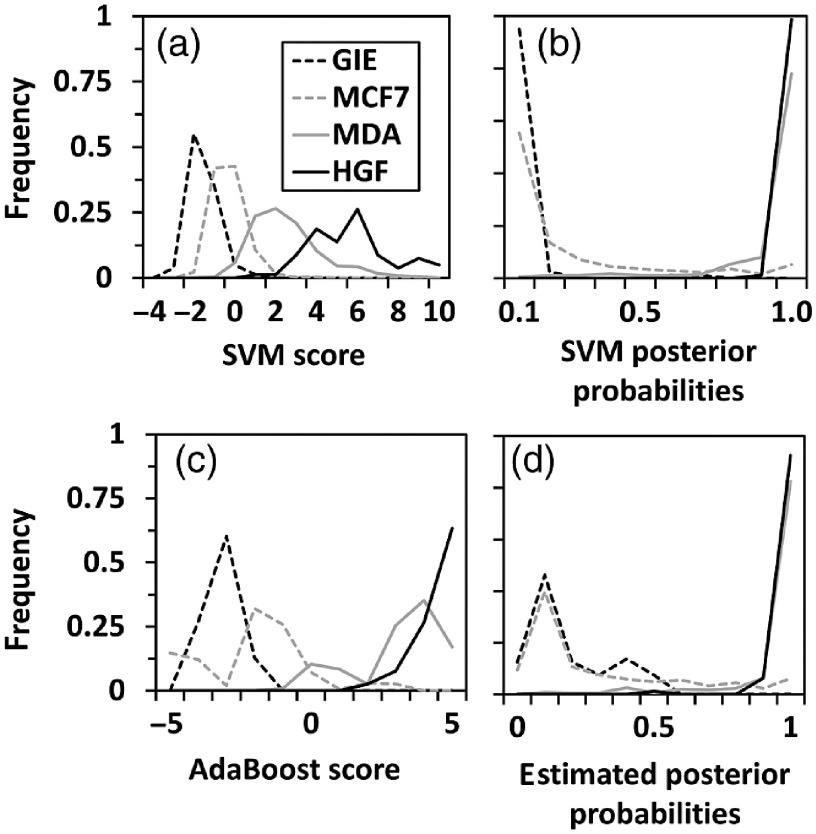
Fig. 5.
Prediction scores for transfer learning of an EM classifier to cancer cells. Histograms of prediction score distributions for (a) SVM predictions, (b) SVM posterior probabilities, (c) AdaBoost predictions, and (d) estimated posterior probabilities from Boosted Trees for test datasets of GIE cells (black dashed line) and HGF cells (black solid line), and transfer learning datasets of MCF-7 cells (gray dashed line) and MDA-MB-231 cells (gray solid line).

