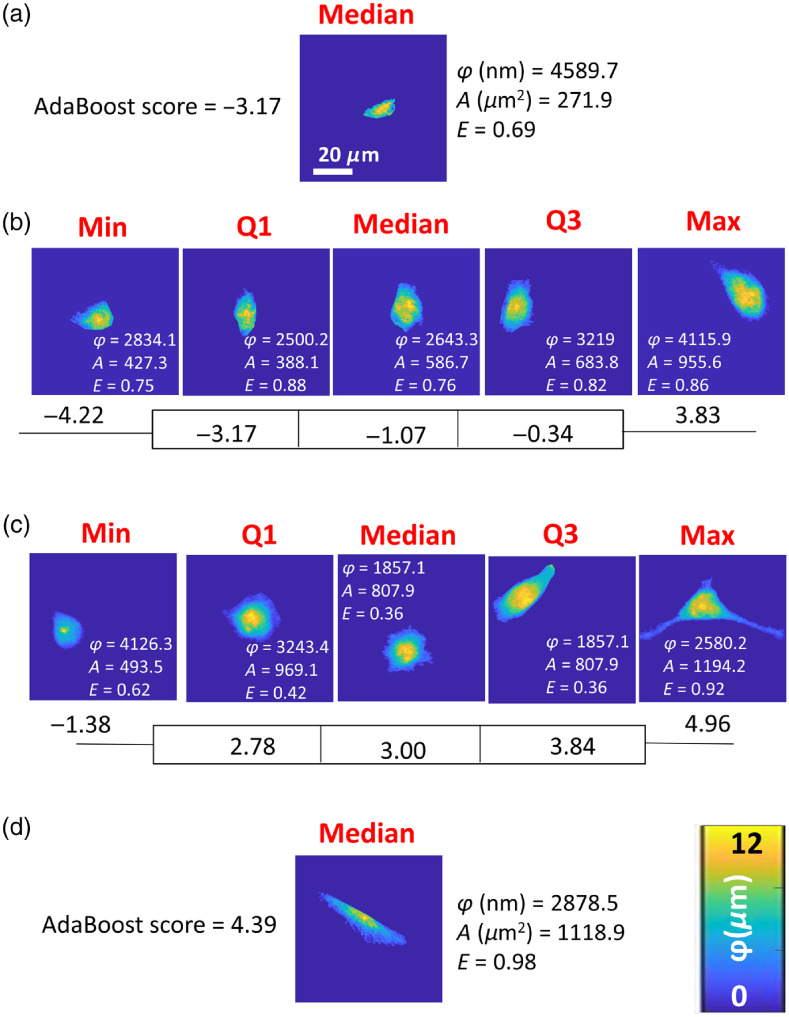
Fig. 8.
Phase maps of epithelial, mesenchymal, and breast cancer cells representing the median AdaBoost score of normal cell line (a) GIE and (d) HGF. The minimum, first quartile, median, second quartile, and maximum AdaBoost score for cancer cell lines of (b) MCF-7 and (c) MDA-MB-231 are shown. AdaBoost scores were derived from a binary classification AdaBoost model trained on GIE and HGF cells, then tested on breast cancer cells to generate weighted classification scores. Phase height () in nm, area () in , and eccentricity () of each representative cell generated from phase maps are also listed in the figure near each cell.

