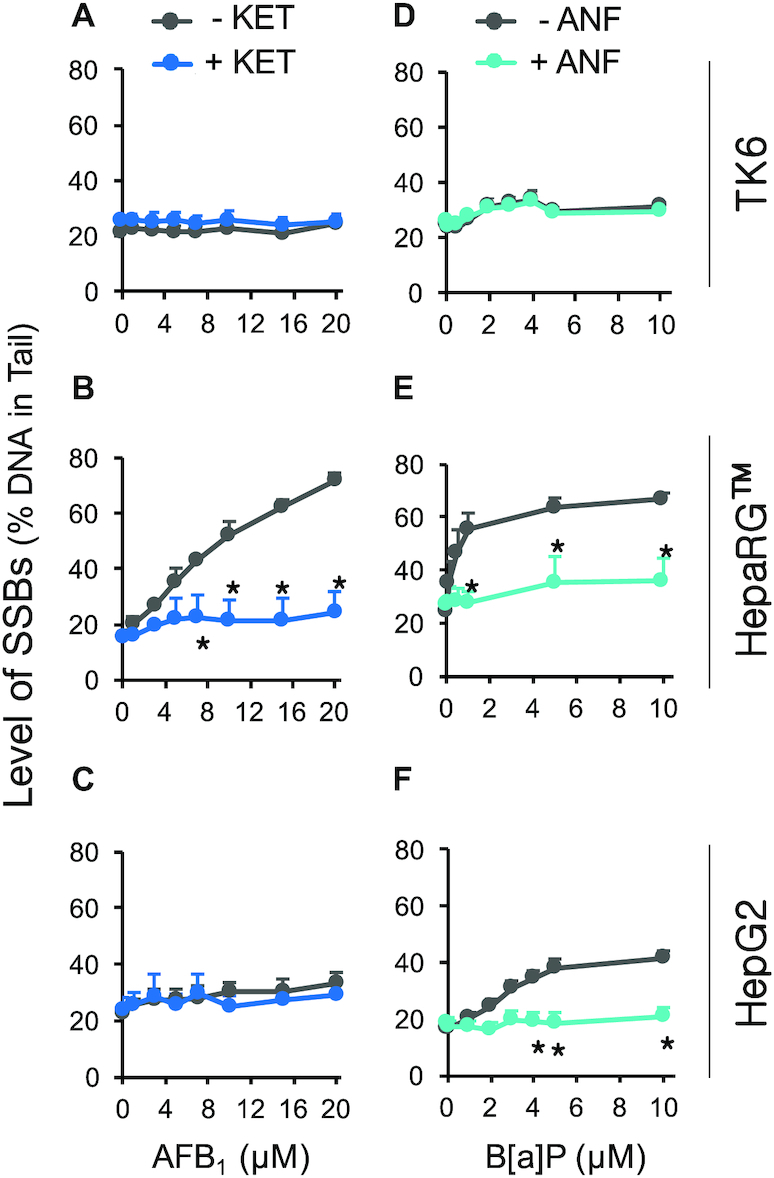
Figure 4.

Role of metabolic activation in induction of SSBs by AFB1 and B[a]P. Cells were treated with AFB1 or B[a]P for 24 h in the presence of 1 mM HU and 10 μM AraC and analyzed with the alkaline CometChip. To inhibit AFB1 metabolic activation, 5 μM KET was added to AFB1 treatment (blue lines in (A), (B) and (C)). To inhibit B[a]P bioactivation, 25 μM ANF was added to B[a]P treatment (teal lines in (D), (E) and (F)). Gray lines represent treatment conditions without KET and ANF. (A) and (D) TK6 cells. (B) HepaRG™ cells (same-day treatment). (E) HepaRG™ (day-7 treatment). (C) and (F) HepG2 cells. n 3. Error bars are standard error of the mean. * P < 0.05, two-way ANOVA with post hoc analysis by Bonferroni test.
