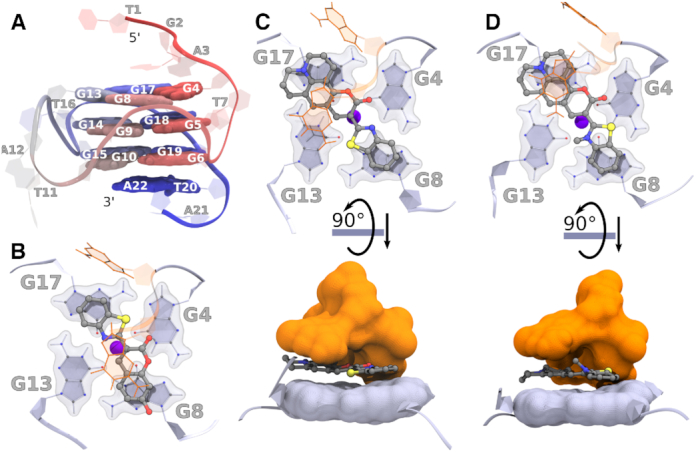
Figure 2.

(A) Labeled overview of Pu22 c-MYC G4 DNA showing the structure with residue numbers only for representation purpose. (B–D) Representative binding poses of compounds during MD simulations with the Pu24T c-MYC G4 DNA. The top G4 tetrad (light blue), nucleotides flanking the G4 DNA structure (orange), and compounds (ball-stick model) from the largest cluster's central structure of (B) 4b, (C) 4l, and (D) 6b. The binding energies are tabulated in Supplementary Table S4. The potassium ion (central blue sphere) is also shown. The rotated view of 4l and 6b shows the compounds sandwiched between the top G-tetrad and the flanking nucleotides.
