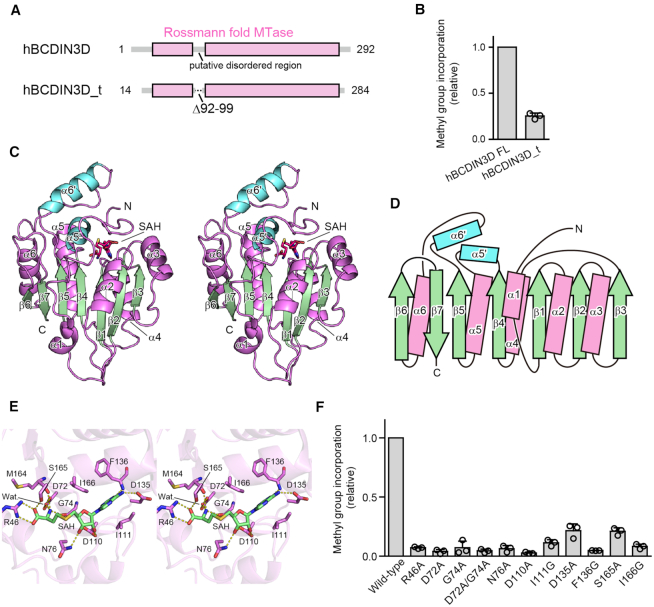
Figure 1.
Overall structure of hBCDIN3D and SAH recognition. (A) Schematic diagrams of hBCDIN3D and its variant hBCDIN3D_t used for crystallization. (B) Relative methylation activity of hBCDIN3D_t (hBCDIN3D as 1.0) under standard conditions. The reaction mixtures were incubated at 37°C for 8 min. At this time point, the reaction by wild-type BCDIN3D proceeds in a linear range. Data are presented as mean ± standard deviation (SD) of three independent assays. (C) Stereo view of the ribbon model of hBCDIN3D, complexed with SAH. Residues 29–91 and 100–264 are modeled in the structure. SAH molecule is depicted by a red stick model. The α-helices and β-strands in the Rossmann fold are colored purple and green, respectively. Additional α-helices, α5′ and α6′, are colored cyan. (D) Topology diagram of hBCDIN3D. hBCDIN3D adopts the classical Rossmann fold. The colors are the same as in (C). (E) Stereo view of the SAH binding site of hBCDIN3D. SAH is depicted by a green stick model. (F) The activities of hBCDIN3D variants relative to the wild type (taken as 1.0) under the standard conditions. The reaction mixtures were incubated at 37°C for 1 h. Data are presented as mean ± SD of three independent assays.

