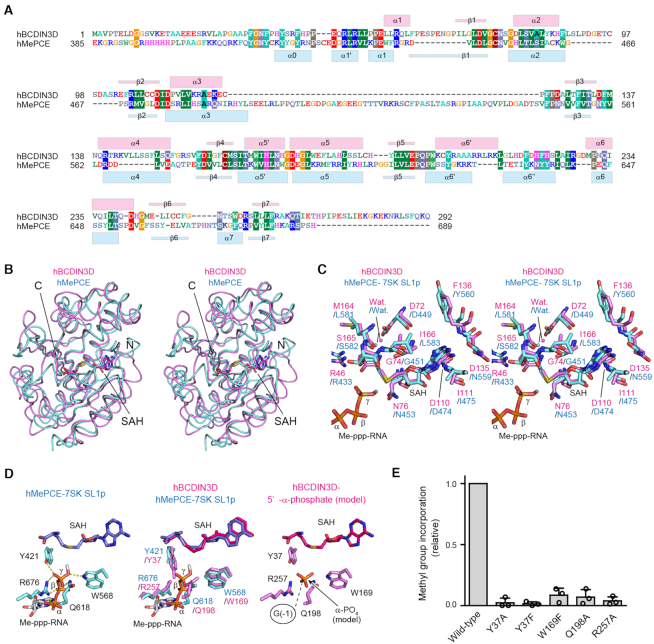
Figure 2.
Comparison between hBCDIN3D and hMePCE. (A) Sequence alignment of hBCDIN3D and the MTD of hMePCE. The secondary structure elements of hBCDIN3D and hMePCE are indicated above and below the alignment, respectively. (B) Stereo view of the superimposed structures of hBCDIN3D (purple) and hMePCE (cyan). SAH molecules are depicted by stick models. (C) Superimposition of the structure of the SAH binding pocket of hBCDIN3D (purple) onto that of hMePCE (cyan) complexed with SAH and 7SK SL1p bearing a monomethyl-γ-phosphate 5′-cap (Me-ppp). The Me-ppp group at the 5′-G1 of SL1p is shown as a stick model. (D) 5′-Phosphate recognition by hMePCE (left). Conserved residues for 5′-phosphate recognition by hBCDIN3D (purple) and hMePCE (cyan) (middle). Possible binding site of the 5′-α-phosphate of the G−1 of tRNAHis in hBCDIN3D. The phosphate group is depicted by an orange stick model. (E) The activities of hBCDIN3D variants relative to the wild type (taken as 1.0) under the standard conditions. The reaction mixtures were incubated at 37°C for 1 h. Data are presented as mean ± SD of three independent assays.

