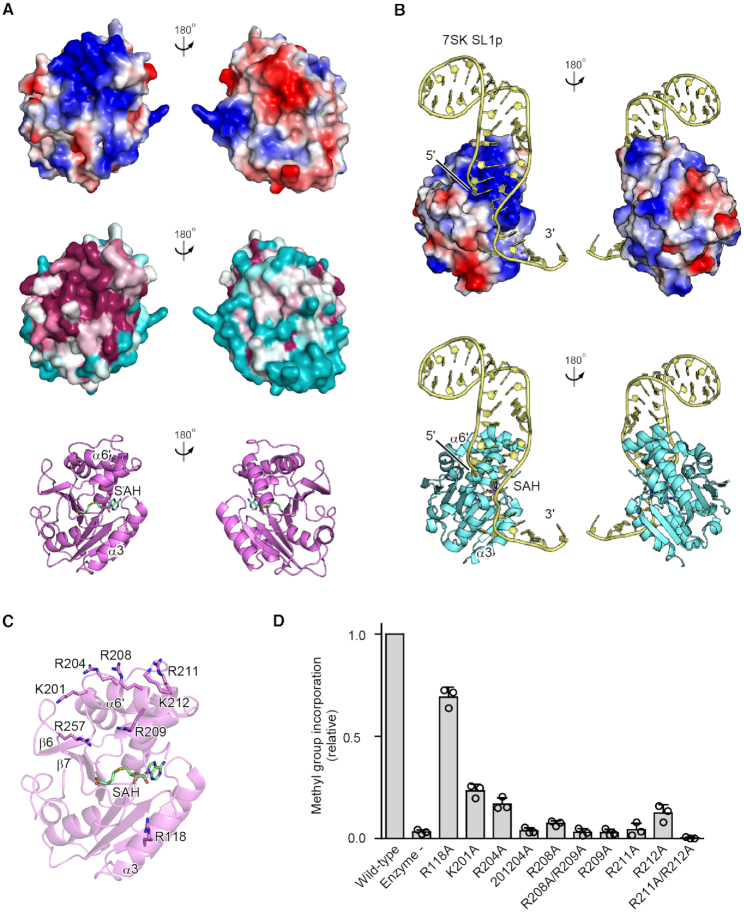
Figure 3.
tRNA binding region in hBCDIN3D. (A) Electrostatic surface potential of hBCDIN3D (top). The positively and negatively charged regions are colored blue and red, respectively. Conservation analysis of hBCDIN3D (middle). Conserved and nonconserved residues are colored purple and cyan, respectively. The positively charged area is highly localized and conserved, and is proximal to the catalytic SAM binding pocket. (B) Electrostatic surface potential of the MTD of hMePCE complexed with 7SK SL1p (yellow) (22). The structure of hMePCE is viewed from the same direction as that of hBCDIN3D superimposed on hMePCE in (A). The positively and negatively charged regions are colored blue and red, respectively, and the distribution of the positively charged area is similar to that of hBCDIN3D. (C) Basic amino acid residues in hBCDIN3D that are possibly involved in the RNA recognition are depicted by sticks. (D) The activities of hBCDIN3D variants relative to the wild type (taken as 1.0) under the standard conditions. The reaction mixtures were incubated at 37°C for 8 min. At this time point, the reaction by wild-type BCDIN3D proceeds in a linear range (Supplementary Figure S2B). Data are presented as mean ± SD of three independent assays.

