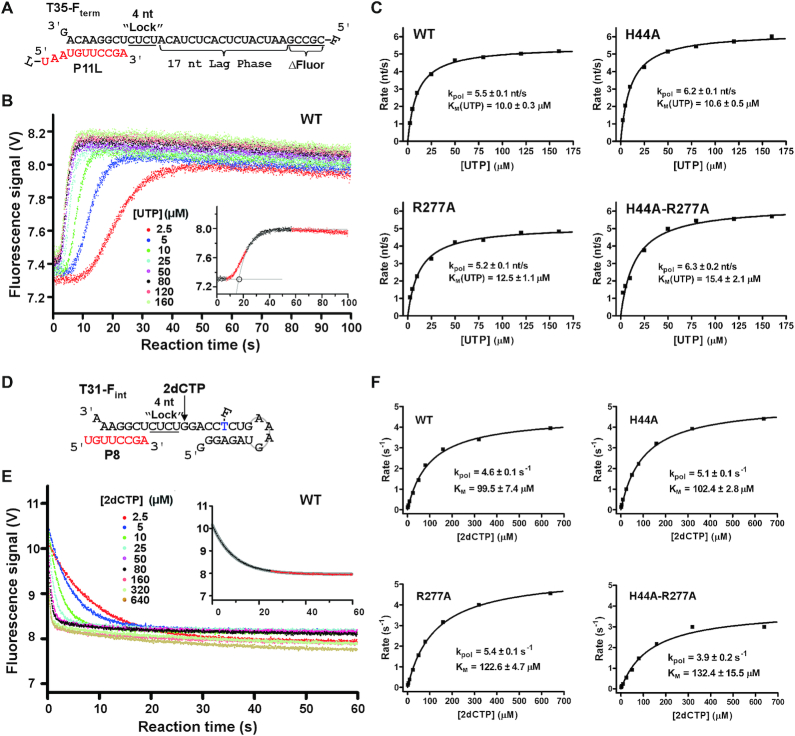
Figure 7.
A comparison of elongation rate of EC formed by four represented EV71_C RdRP constructs. (A) The RNA constructs used to determine an average elongation rate constant. The 5′-fluorescein (F) labeled template (T35-Fterm) and the P11L primer were designed to have a 17-nt lag phase after a 4-nt incorporation (corresponding to the underlined CUCU ‘Lock’ template sequence) for EC assembly and before the fluorescence signal increase upon the last five nucleotides incorporation (ΔFluor). (B) Data from the WT construct showing a decrease in lag time with increasing concentration of UTP. Bottom right: a simple analysis was applied by fitting the latter part of the signal increase to a single exponential rise and by using the interception of this curve and the initial signal level to estimate the lag time for synthesizing the 17 nt. (C) The average elongation rates derived from data in panel B were fitted to the Michaelis–Menten equation to calculate the kpol and KM values for each construct. (D) The RNA constructs used to determine a single-nucleotide elongation rate constant. The internal fluorescein labeled template (T31-Fint) and the P8 primer were designed to have an immediate fluorescence signal decrease upon a 2dCMP incorporation after a 4-nt incorporation (corresponding to the underlined CUCU ‘Lock’ template sequence) for EC assembly. (E) Data from the WT construct showing faster signal decrease with higher 2dCTP concentration. Top right: the data were fitted to a single exponential decay model to estimate the elongation rate with the latter part of the data omitted due to deviation of the single-exponential behavior. (F) The elongation rates derived from data in panel E were fitted to the Michaelis–Menten equation to generate the kpol and KM values for each construct.

