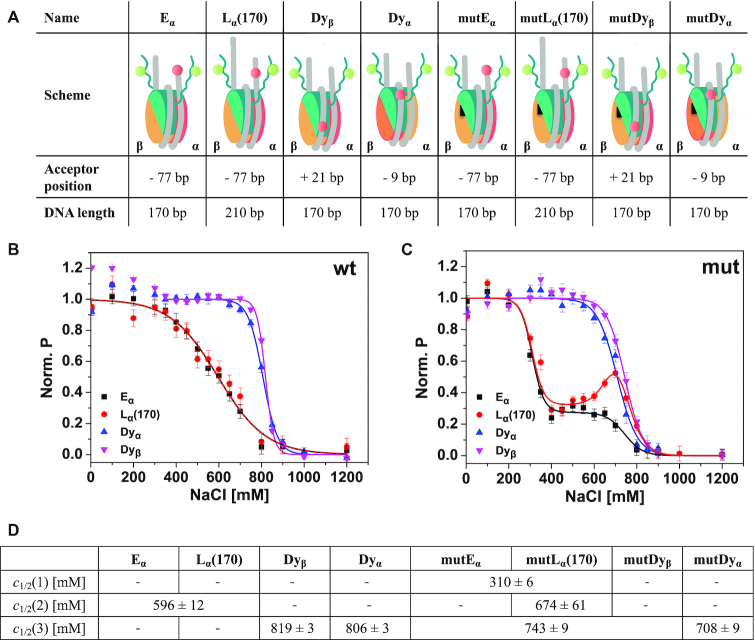
Figure 1.
Schematic representation of the used labeled constructs and ensemble analysis of salt-induced proximity changes between H3NtT and the nucleosomal DNA. (A) In the cartoon representations H2A–H2B dimer on α-side is shown in orange, H2A–H2B dimer on β-side is shown in yellow, (H3–H4)2 tetramer in turquoise, DNA in gray. The black triangle on the H2A–H2B dimers indicates mutated nucleosomes bearing two point mutations in the α3 domain of H2A, namely H2A R81E/R88E. The donor on H3K9C is shown as a green circle. The acceptor is shown as a red circle and labeling positions on the DNA are given as relative base shifts to the dyad axis. Dyα: acceptor close to dyad axis at position −9, Dyβ: acceptor close to dyad axis at position +21, Eα: acceptor at the end of a 170 bp long DNA at position −77, Lα(170): acceptor at position −77 on a 210 bp long DNA, mut: nucleosomes bearing the H2A R81E/R88E mutation. (B) Ensemble FRET analysis of distance changes between wild type H3NtT and various positions on the DNA. For visualization, data were normalized to the maximal and minimal amplitude of the sigmoidal fit (Equation 2). Labeled nucleosomes were measured at 300 pM total concentration after 1 h incubation in buffers with different NaCl content. (C) Ensemble FRET analysis of distance changes between H3NtT and the DNA in mutated nucleosomes. Inflection points of the proximity curves are significantly lower in mutDα and mutDyβ nucleosomes; curve progression is changed to two-step behavior in Eα and Lα(170), indicating allosteric effects induced by the mutation. (D) Results of global fit of Equation (2) to the data in B, C (for full set of fit parameters and individual fits see Supplementary Table S1 and Figure S4, respectively). Empty fields: parameter not needed in the fit, joint fields: global parameter.

