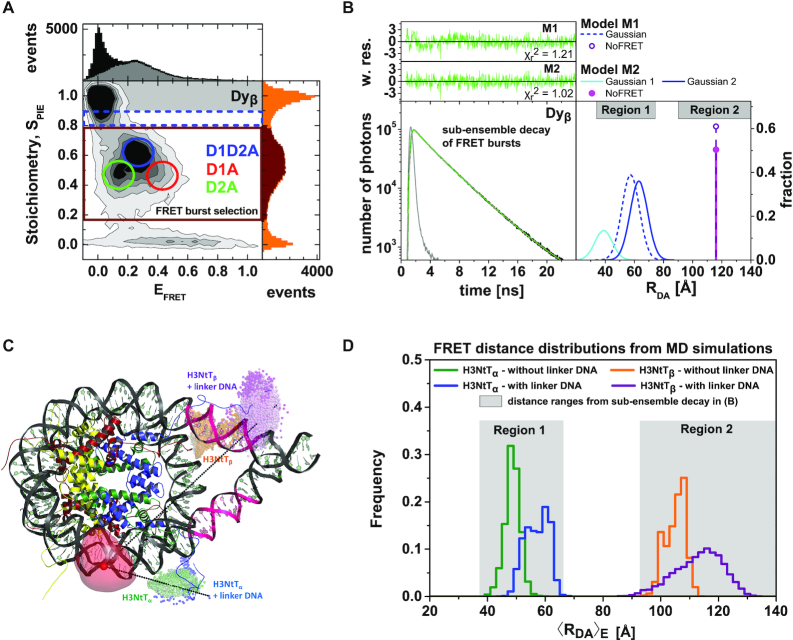
Figure 2.
MFD-PIE analysis of H3NtT:DNA interactions and sub-ensemble donor decay analysis in presence of FRET based on donor–acceptor distance distribution. Data for all plots are obtained at 100 mM NaCl from 40 pM Dyβ nucleosomes in the presence of 1960 pM or 260 pM unlabeled nucleosomes. (A) MFD-plot for stoichiometry, SPIE (Equation 6) versus FRET efficiency EFRET (Equation 5). Subspecies (D1A, D2A and D1D2A) are identified according to their position in the 2D distribution and indicated with circles. (B) Sub-ensemble histogram of the donor fluorescence intensity decay (lower left panel) from the selected FRET bursts (wine box in Figure 2A) and best fit model curve (green line). The decay histogram was analyzed by two models composed of two and three species (lower right panel): (M1) one Gaussian distributed distance (blue dashed line) and a donor-acceptor NoFRET-species (purple dashed line, corresponding to the distances larger than 95 Å), and (M2) two Gaussian distributed distances (cyan and blue lines) and a donor-acceptor NoFRET-species (magenta vertical line, corresponding to the distances larger than 95 Å) (see Material and Methods: Sub-ensemble TCSPC). The weighted residuals shown on top with the reduced sum of the weighted squared deviation between the model and the data of the decay histogram,  , demonstrate that higher fit quality was achieved by model M2. (C) Visualization of the dye accessible volume mean positions (spheres) for donors on both H3NtTs estimated from two distinct MD simulations: nucleosome without linker DNA (147 bp) (34): green—H3NtTα, orange—H3NtTβ, and nucleosome with linker DNA (187 bp) (25): blue—H3NtTα, purple—H3NtTβ (lighter shades indicate later simulation time). The accessible volume of the acceptor position +21 bp is shown as transparent red surface, the corresponding mean position is shown as a sphere. The preferential interaction areas of the linker DNA with the histone tails that were identified by crosslinking studies (31) are highlighted in magenta. (D) 〈RDA〉E distance distributions from two distinct MD traces in (C) computed by FPS (45) for the four cases. Two separate populations are clearly visible for H3NtTα (38–68 Å) and H3NtTβ (95–120 Å). These distance ranges agree well with the two distance ranges of experimental observations (gray regions) obtained by sub-ensemble time correlated single photon counting (seTCSPC) decay histogram analysis, Table 1.

