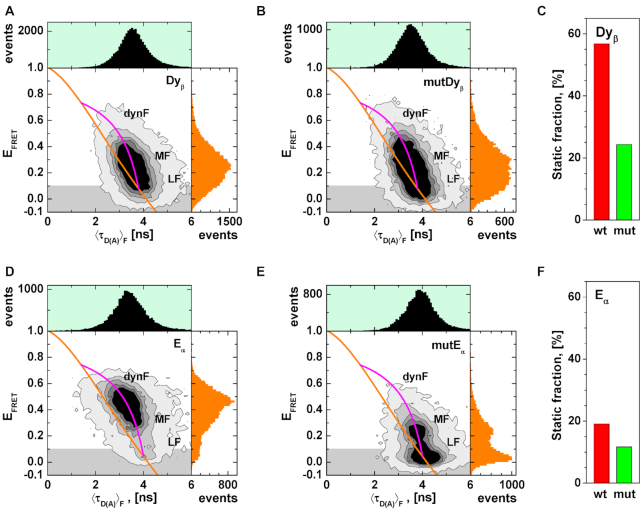
Figure 3.
MFD analysis of H3NtT:DNA interactions in presence of FRET. (A) Dyβ: FRET efficiency (EFRET) plotted versus fluorescence weighted average donor lifetime (〈τD(A)〉F). (B) FRET efficiency (EFRET) versus fluorescence weighted average donor lifetime (〈τD(A)〉F) for mutDyβ nucleosomes. (C) Total static fractions of wt Dyβ (red bar) and mutDyβ (green bar) nucleosome samples obtained by dynPDA. (D) Eα: FRET efficiency (EFRET) plotted versus fluorescence weighted donor lifetime (〈τD(A)〉F). (E) FRET efficiency (EFRET) versus fluorescence weighted average donor lifetime (〈τD(A)〉F) for mutEα nucleosomes. (F) Total static fractions of wt Eα (red bar) and mutEα (green bar) nucleosome samples obtained by dynPDA. The orange line represents the EFRET–〈τD(A)〉F relation for static FRET species (all parameters for the FRET lines are described in Supplementary Note 1). The magenta line represents the EFRET–〈τD〉F relation for dynamic FRET species. The comparison of the total static fractions in Dyβ and Eα nucleosome samples demonstrates the fast dynamics of the DNA arm.

