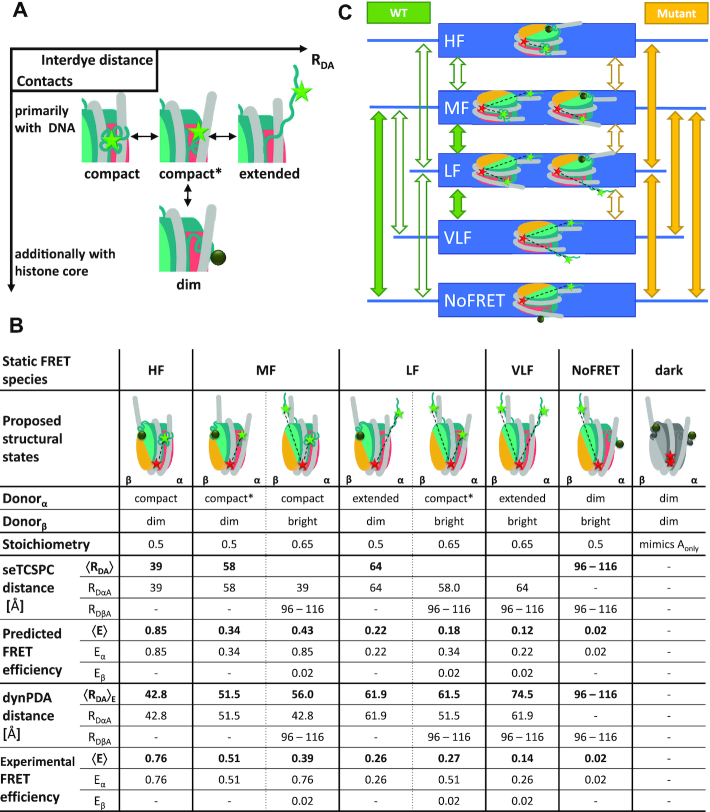
Figure 4.
Structural model for H3NtT conformations and observed transitions in nucleosomes. (A) Proposed four conformational states for each H3NtT. The dynPDA model reveals three possible transitions between them: (i) compact ↔ compact*, (ii) compact* ↔ extended and (iii) compact* ↔ protein associated/dim state. (B) Assignment of all possible combinations of the assumed H3NtT conformations ( ) to the five static FRET states. The dynPDA model with five static states was defined based on sub-ensemble donor decay analysis results. The states are named with respect to their corresponding FRET efficiency level. The RDA distances were extracted from the MFD measurements by dynPDA analysis. The average FRET efficiencies, 〈E〉, for species with two bright donors were calculated as arithmetical mean of two FRET efficiencies corresponding to the shown RDαA and RDβA distances (67). Bright donor and acceptor fluorophores are shown as green or red stars, respectively. Dim donor fluorophores are shown as dark green circles. (C) dynPDA model containing five static states and seven dynamics species. Green and orange arrows correspond to possible transitions in wt nucleosomes and mutated nucleosomes, respectively. Filled arrows indicate that transitions are significantly populated (>7%), whereas open arrows refer to transitions, which are allowed in the dynPDA model, but are not significantly populated according to the PDA global fit. Three transitions are generally excluded based on direct structural transition defined in (A): HF↔NoFRET, HF↔VLF and VLF↔NoFRET.

