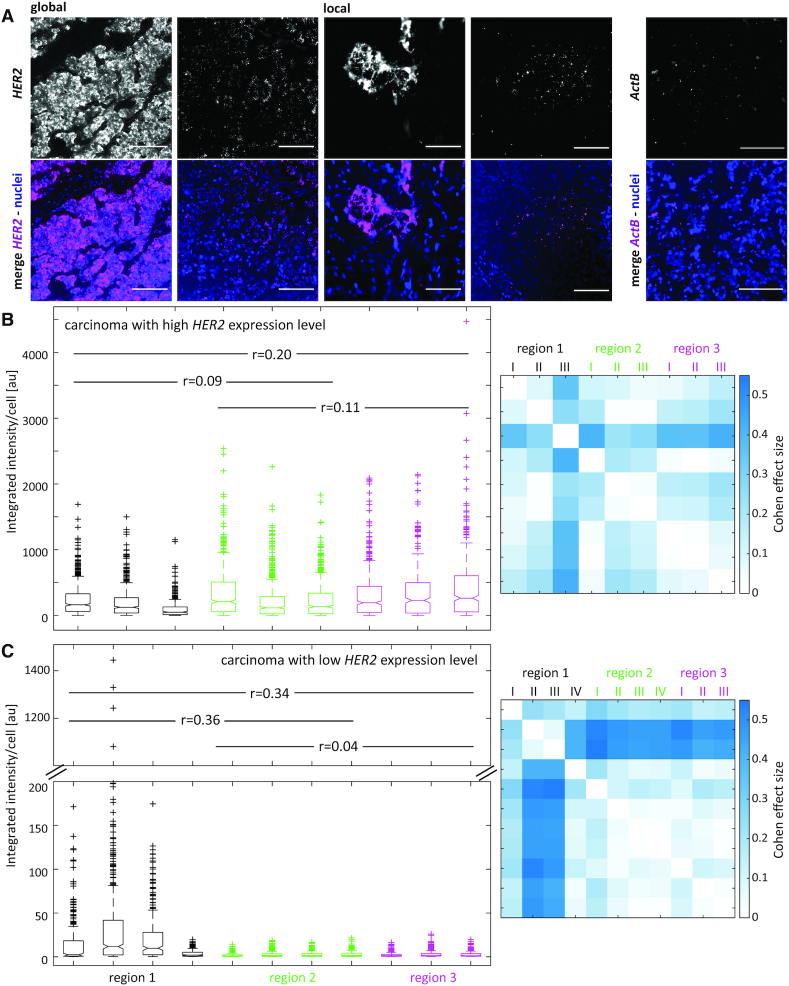
Figure 4.
Spatially multiplexed RNA-ISH to detect spatial tumor heterogeneity in mammary carcinoma sections. (A) Fluorescence images of RNA-ISH signals detected for HER2 and ActB by global ISH or local ISH experiments on mammary carcinoma sections. Nuclei visualized using DAPI. The images display the inter- and intratumor heterogeneity of the HER2 expression. Scale bar: 100 μm. (B, C) Integrated fluorescence intensity of the HER2 signal per sectioned cell in three different regions of a strongly (B) (35 HER2 copies, HER2 IHC 3+) and low (C) (five HER2 copies, HER2 IHC 2+) HER2-expressing carcinoma tissue section (left). Using a Mann–Whitney test, the Cohen effect size (r) for interregional heterogeneity was calculated from the combined areas (I–IV) within a region and displayed by the values given in the graph on the left. A matrix of Cohen effect sizes calculated for the individual areas within or between regions (intraregional and interregional heterogeneity) is shown on the right. Corresponding regions are shown on hematoxylin and immunohistochemically stained tissue sections in Supplementary Figure S11A and B.

