Figure 5.
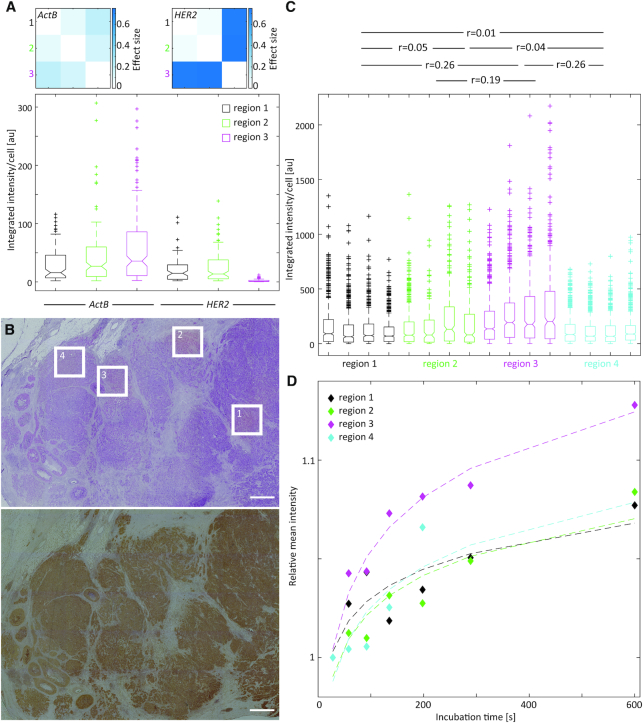
Differential HER2 gene expression in mammary carcinoma sections. (A) Integrated RNA-ISH fluorescence intensity per cell section for ActB and HER2 in a mammary carcinoma section (lower image). Cohen effect sizes describing interregional differences in expression levels calculated using a Mann–Whitney test are shown as matrices for ActB and HER2, respectively (upper images). (B) Histological overview of the tumor tissue section stained with hematoxylin and eosin (upper image) and HER2 immunohistochemistry (lower image) with the regions 1–4 used for local RNA-ISH detection in (C). Scale bar: 1 mm. (C) Integrated RNA-ISH fluorescence intensity (HER2) per cell section for four areas in each of the four different tumor regions in a mammary carcinoma section with a HER2 IHC status of 3+. The entire tissue sections including the regions of interest are shown as hematoxylin and IHC stained tissues in Supplementary Figure S11C. The Cohen effect size (r) for interregional heterogeneity was calculated from all areas (1–4) within each region combined by using a Mann-Whitney test and its values are displayed above the graph. (D) Quantitative immunohistochemistry using a gradient of primary antibody incubation times by local antibody delivery (24). The graph shows the relative mean intensity of the diaminobenzidine (DAB) signal after the amplification of the secondary antibody signal through a horseradish peroxidase reaction versus the incubation time of the primary antibody. It provides a quantitative measure of protein expression levels.

