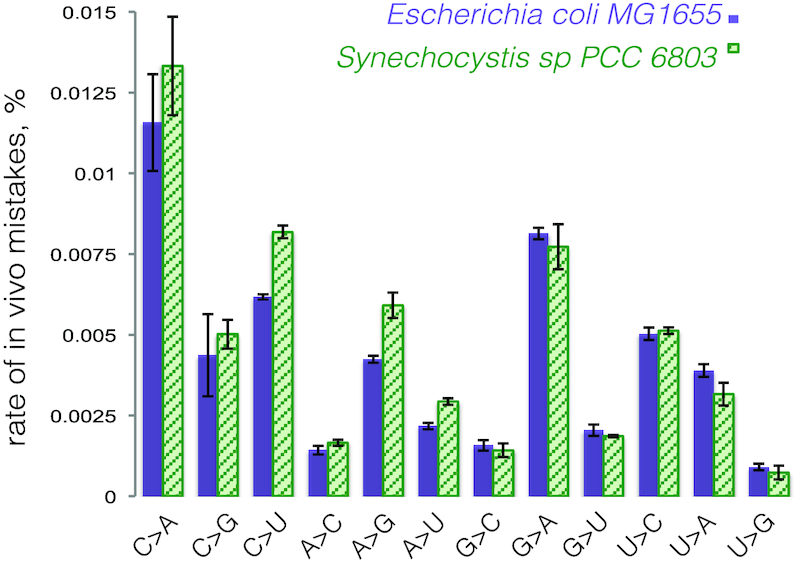
Figure 2.

Rates of in vivo transcriptional mistakes are comparable between E. coli MG1655 and Synechocystis sp. PCC 6803. The graph shows percentages of total specific in vivo mistakes in mature transcripts for E. coli MG1655 and Synechocystis sp. PCC 6803, at specific positions of the sequencing read, calculated based on Next Generation Sequencing of total RNA from two species (See Methods for details). Error bars represent standard deviation from biological triplicates.
