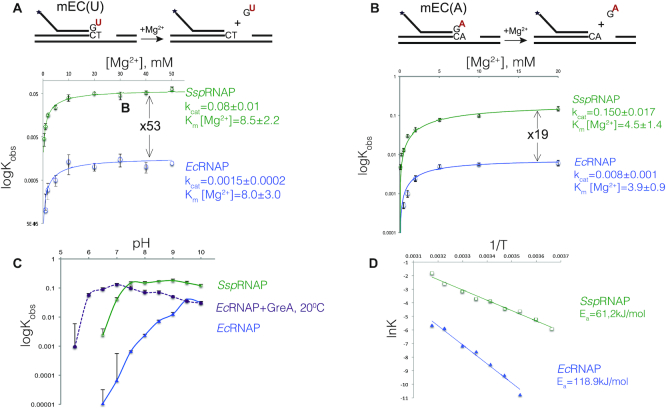
Figure 3.
Molecular mechanism of fast transcript hydrolysis by SspRNAP. (A and B) Mg2+ dependencies of the hydrolysis rate of the penultimate phosphodiester bond in mEC(U) and mEC(A), respectively, by Ec and SspRNAPs. Schematics above the plots show the elongation complex structures and the hydrolysis reaction it undergoes; asterisk indicates that RNA is labelled at the 5′ end. Solid lines represent the graphical fits of data (using SigmaPlot software) to the Michaelis-Menten equation. The kcat and KM [Mg2+] (23) values are shown next to the plots. Error bars represent standard deviations from triplicate experiments. (C) pH profiles of second phosphodiester bond hydrolysis in mEC(A) complex for the intrinsic hydrolysis reaction by EcRNAP, GreA assisted hydrolysis by EcRNAP (at 20°C) and SspRNAP. The data points are averages of three independent experiments (standard deviation for each experimental point were within 10–15% value). (D) Arrhenius plots for hydrolysis reaction in mEC(U) complex by EcRNAP and SspRNAP, graphical fits of lnK to 1/T data to linear equation are shown as a straight line, apparent activation energy calculated from equation ln K = ln A – Ea/R(1/T) is shown on the plot. The data points are averages of two independent experiments.

