Figure 2.
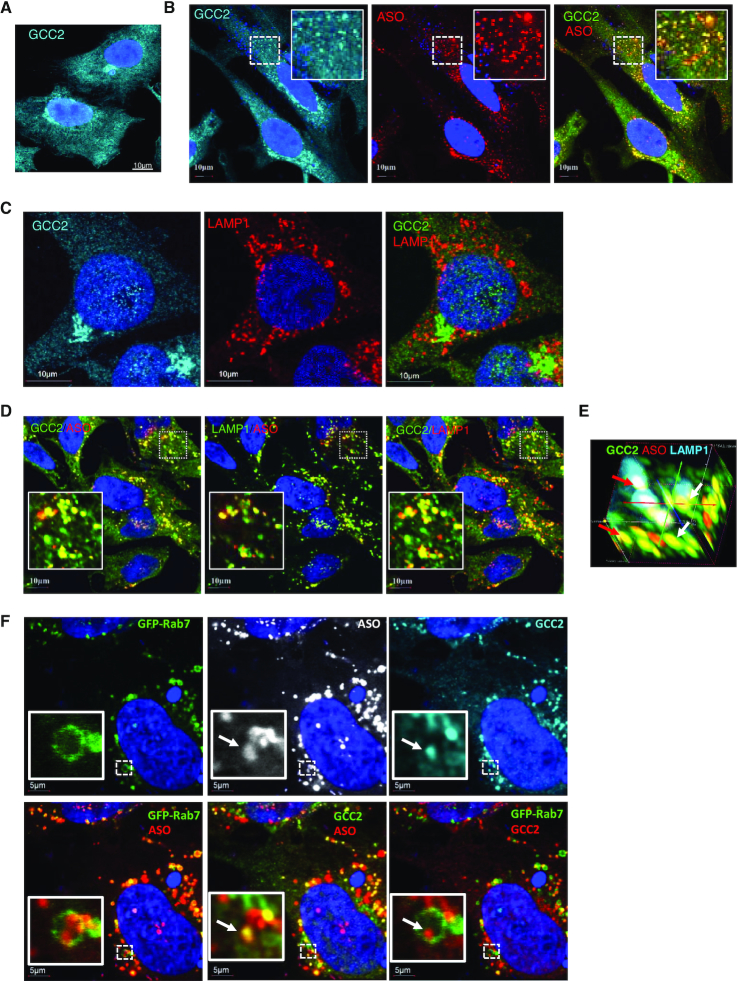
GCC2 localizes to LEs in HeLa and SGVA cells treated with PS-ASO. (A) Immunofluorescent staining of GCC2 in HeLa cells. Scale bar, 10 μm. (B) Immunofluorescent staining of GCC2 in HeLa cells incubated with 2 μM Cy3-labeled PS-ASO 446654 for 18 h. Scale bars, 10 μm. The regions boxed with dashed lines are magnified in the insets. (C) Immunofluorescent staining of GCC2 and LAMP1 in HeLa cells. Scale bars, 10 μm. (D) Immunofluorescent staining of GCC2 and LAMP1 in HeLa cells incubated with Cy3-labeled PS-ASO 446654 for 18 h. Scale bars, 10 μm. (E) 3D image of GCC2, PS-ASO and LAMP1 co-localization in HeLa cells incubated with Cy3-labeled PS-ASO 446654 for 18 h. The image was compiled from 25 sections taken at 0.1 μm depth. Two vesicles are marked with red and white arrows. (F) Immunofluorescent staining of GCC2 in GFP-Rab7-expressing SVGA cells incubated with 2 μM Cy3-labeled PS-ASO 446654 for 18 h. Scale bars, 5 μm. The regions boxed with dashed lines are magnified in the insets. The co-localization of GCC2 with PS-ASOs inside an LE is marked with an arrow.

