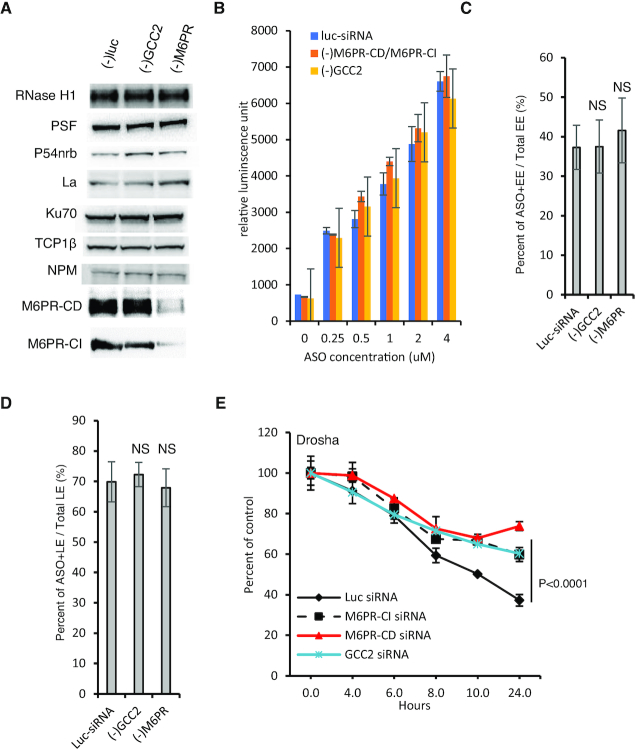
Figure 4.
In cells depleted of GCC2 and M6PR PS-ASO release from LEs is impaired. (A) Western analyses of indicated proteins in control siRNA-treated HeLa cells or cells treated with siRNAs targeting GCC2 or M6PR for 72 h. Equal amounts of proteins were loaded in each lane. (B) Flow cytometry analysis of Cy3-labeled PS-ASO 446654 uptake into HeLa cells treated with a control siRNA or siRNAs targeting GCC2 or M6PR for 72 h. Error bars are standard deviation from three independent experiments. (C) Quantification of the EEs containing Cy3-labeled PS-ASO after incubation of HeLa cells pretreated with siRNAs, and subsequently with PS-ASO 446654 on ice for 20 min and then at 37°C for 25 min. The percentages of PS-ASO-containing EEs relative to the number of total EEs were calculated and average values plotted. Error bars are standard deviations of data from 20 cells. P-value was calculated based on unpaired t-test. NS, not significant. (D) Quantification of the PS-ASO-containing LEs in cells pre-treated with control siRNA or siRNAs targeting GCC2 or M6PR and then treated with PS-ASO 446654 on ice for 20 min and then at 37°C for 45 min. The percentage of ASO-containing LEs relative to the number of total LEs was calculated and average values plotted. Error bars are standard deviations of data from 20 cells. P-value was calculated based on unpaired t-test. NS, not significant. (E) qRT-PCR quantification of the levels of Drosha mRNA in HeLa cells. Cells were pretreated with control siRNA or siRNAs targeting GCC2 or M6PR and then with PS-ASO 25691 for 2 h, medium containing PS-ASO was removed, and mRNA was quantified at indicated time points. Error bars are standard deviations from three independent experiments. P-values were calculated based on F-test.

