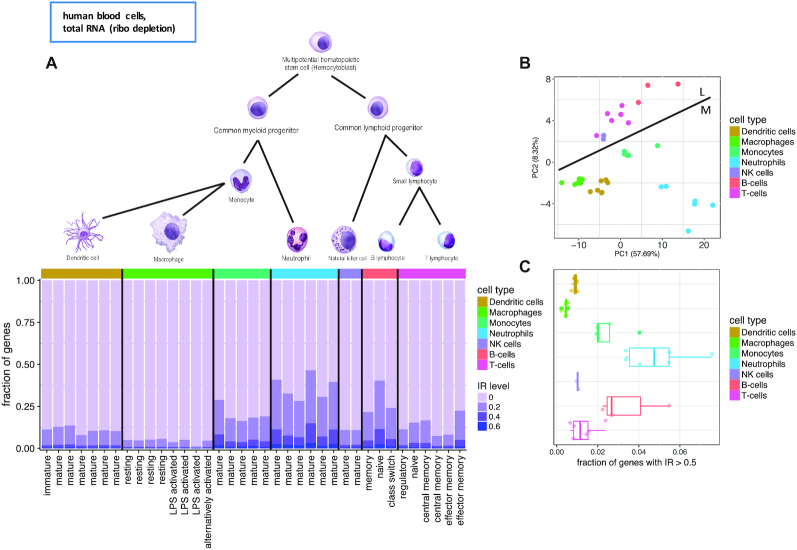
Figure 1.
Intron retention (IR) in differentiated primary human blood cells from the Blueprint consortium. (A) Differentiated cells of the hematopoietic tree. Fraction of genes with IR level above displayed threshold (20, 40 and 60%) for the highest retained intron per gene. Cell types identified by color code, subtypes by the X-axis labels. (cell type drawings adapted from OpenStax Anatomy and Physiology Textbook Version 8.25). (B) First two principal components of the PCA based on the IR values from the introns quantified in all samples (i.e. introns with cell type specific IR were omitted). Line indicates separation between the lymphoid (L) and myeloid (M) branch. (C) Fraction of genes with >50% retention of their most retained intron.

