Figure 5.
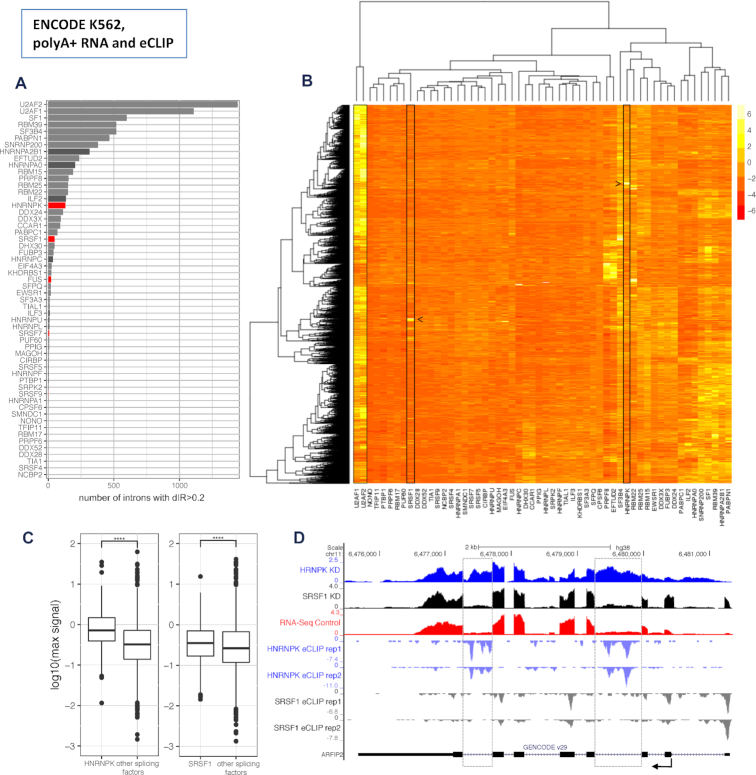
Candidate splicing factors to regulate IR (data from the human ENCODE project). (A) Number of introns that increase retention (dIR > 0.2) upon shRNA knockdown of 58 splicing factors in K562 cells from ENCODE. Mean values of two technical replicates per splicing factor normalized by the median of non-targeted control samples. Core splicing factors in grey, non-core splicing factors in black and non-core factors with enriched binding motives in dIR introns 4F) in red. (B) Hierarchical clustering based on IR of the 3102 retained introns with dIR >0.2 for at least one splicing factor knockdown. Mean values of two technical replicates per splicing factor normalized by the median of non-targeted control samples and z-transformed by intron. While core splicing factors like U2AF1 and U2AF2 affect many introns, SR-rich and hnRNP proteins like SRSF1 and HNRNPK (boxed in the plot) have rather distinct sets of intronic targets (identified by arrows). (C) eCLIP derived HNRNPK and SRSF1 strength of binding in the top 100 introns each with their strongest effect on dIR upon their knockdown compared to the strength of binding of nine other non-core splicing factors (see methods) within the same introns in K562 cells. Values are the maximum signal (see Materials and Methods) values within the intronic sequence. (D) RNASeq data of the HNRNPK (blue) and SRSF1 (black) knockdown experiments versus an untreated control (red) in K562 cells from ENCODE for the gene ARFIP2 (top rows). eCLIP binding data for HNRNPK (light blue) and SRSF1 (grey) along the sequence of ARFIP2 (bottom row). Most affected introns are marked by a dashed grey box.

