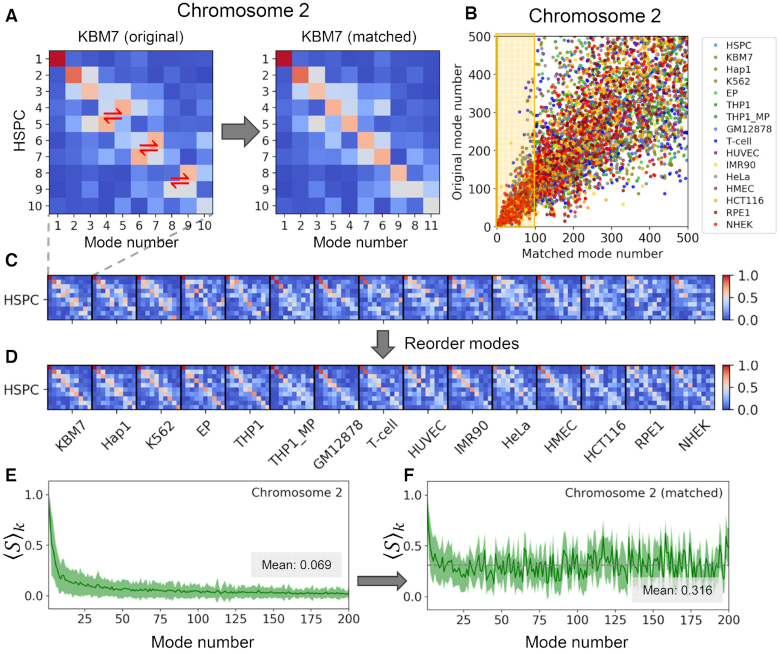
Figure 3.
Conservation profile of soft modes and mode-mode overlaps across different cell lines, illustrated for chromosome 2. (A) Mode-mode matching process illustrated for the softest 10 modes of HSPC and KBM7. The entries in the heat map are the mode-mode correlation cosines, with the strength of correlations decreasing from red to blue. Red two-way arrows display the modes that are swapped to result in the map on the right. (B) Comparison of the original (abscissa) and reassigned (ordinate) mode numbers after optimal matching to the mode numbers of the reference cell (HPSC). Results for different cell types are color-coded, consistent with previous figures. (C, D) Same as panel (A), displayed mode-mode overlaps between all (15) pairs of cell types and the reference HPSC, and their reordering to identify equivalent modes. (E, F) Conservation level of the first 200 modes before (E) and after (F) mode-mode matches, similar to Figure 2A, B, but shown here for chromosome 2. The gray dashed lines in E and F indicate the respective mean values of 0.069 and 0.316.

