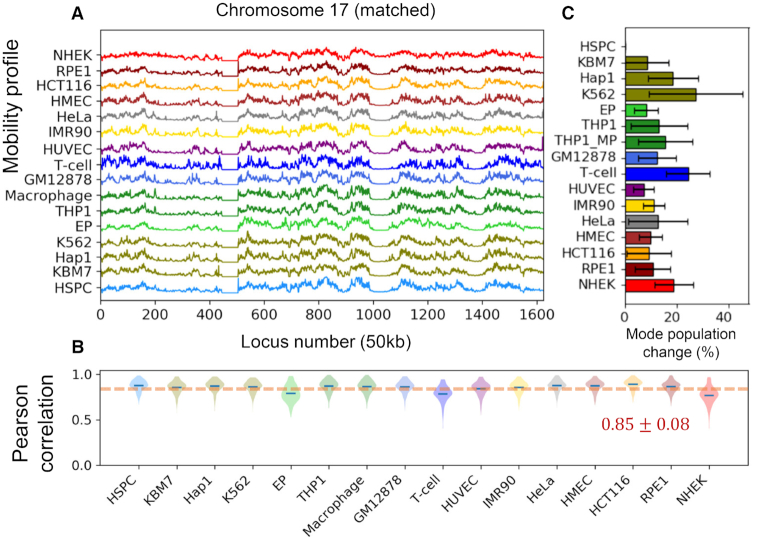
Figure 4.
Verification of the close similarity of the spectrum of motions after eliminating the differences originating from the frequency dispersion. (A) Mobility profiles of genomic loci on chromosome 17 based on first 500 matched modes identified for all cell lines. (B) Distribution of Pearson correlations between the chromatin mobility profiles of each cell type and all others, obtained with the same set of modes. (C) Percent change in mode population after inclusion of equivalent modes for each cell line, averaged over all chromosomes. The error bars indicate the standard deviation among chromosomes. HSPC has no change because it is used as the reference.

