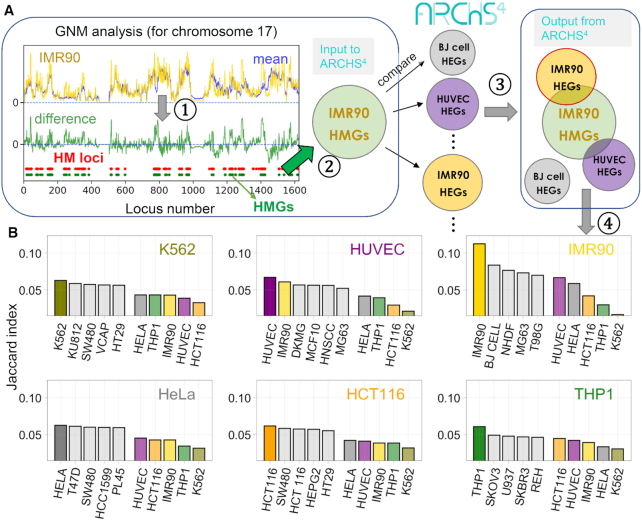
Figure 6.
Strong correlation between cell-type-specific highly mobile genes (HMGs) and highly expressed genes (HEGs). (A) Illustration of the 4-step protocol in silico test of the relationship between HMGs and HEGs for IMR90 as a query cell: (1) Identification of high mobility (HM) loci from the difference (green curve) between the mobility profile obtained with the GNM (shown here for IMR90 chromosome 17; yellow curve), and that averaged across all 16 cell lines (blue curve); HM loci are defined as those exhibiting the top 10% mobility, shown by the red dots. (2) Genes located in HM loci, HMGs, are identified (shown by green dots). The procedure is repeated for all chromosomes, and the resulting list of HMGs for IMR90 chromatin is used for screening against the cell-type specific HEGs compiled in the ARCSH4 database; (3) Similarities between the HMGs of the query cell type and the HEGs of the 125 cell types in ARCSH4 are measured by the Jaccard index, and rank-ordered for each query cell type; (4) Top-ranking five (screened) cell lines whose HEGs exhibit the highest overlap with the HMGs of the query cell are shown by the bar plots in panel B. Results are presented in (B) for six of our dataset cell types that were represented in ARCSH4, and the corresponding Jaccard scores are additionally displayed (right colored bars) in each case for comparison. The top-ranking cell type (from the pool of 125 in ARCSH4) turns out to be the query cell type itself, demonstrating the distinctive overlap between HMGs and HEGs specific to each cell type.

