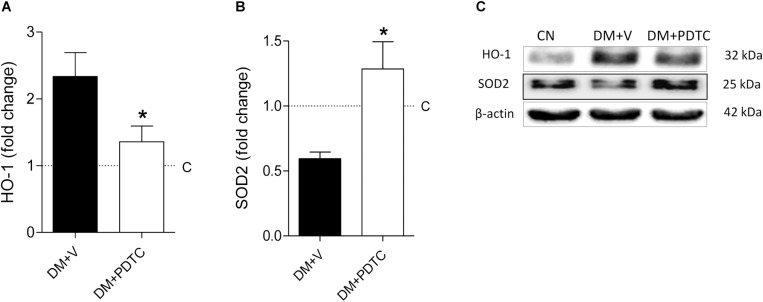
FIGURE 7.
Renal cortical abundance of (A) heme oxygenase-1 (HO-1) and (B) superoxide dismutase 2 (SOD2), quantified by Western blot analysis (C) in rats treated with the NF-κB inhibitor pyrrolidine dithiocarbamate (Group DM+PDTC, n = 11) or vehicle (Group DM+V, n = 16) at 12 months of DM. The values obtained from the groups DM+V and DM+PDTC were factored by age-matched controls rats (C, horizontal dotted lines). Results expressed as means ± SE. * p < 0.05 vs. DM+V.

