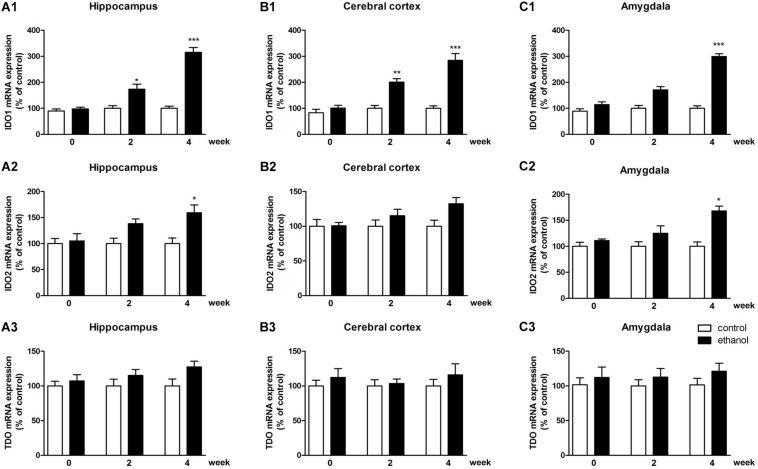
FIGURE 3.
mRNA expressions of IDO1 (A1–C1), IDO2 (A2–C2) and TDO (A3–C3) in the hippocampus, cerebral cortex, and amygdala in drinking mice at 0, 2, and 4 weeks. n = 8 per group, and data were assessed by two-way ANOVA followed by a Duncan test. *p < 0.05, **p < 0.01, and ***p < 0.001 compared with control group.

