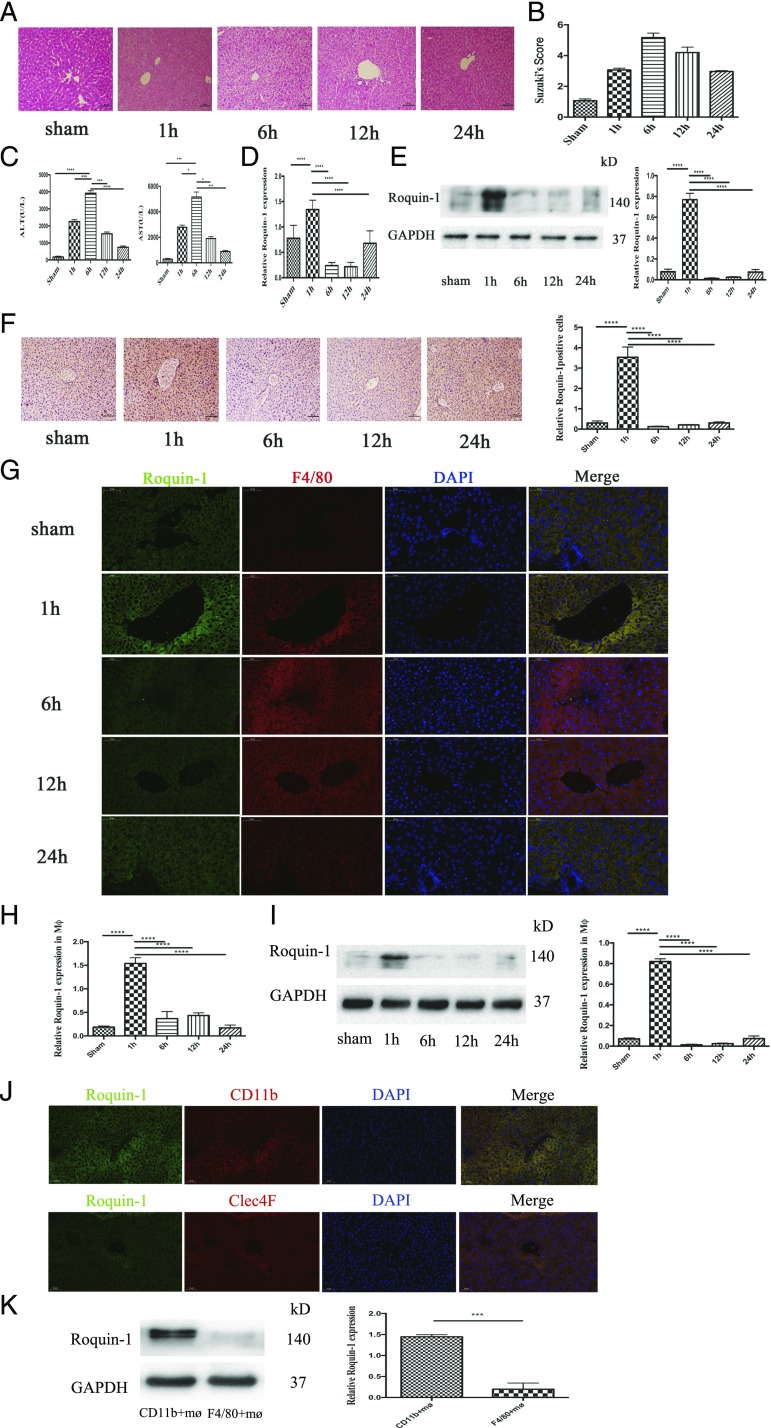
FIGURE 1.
The change of Roquin-1 in liver IRI. (A) H&E staining of liver in mice liver IR (n = 6). Scale bars, 100 μm. (B) Suzuki score in mice liver IR (n = 6). (C) Serum ALT and AST levels in mice liver IR (n = 6). (D–F) Quantitative RT-PCR, WB, and immunohistochemistry results suggest that Roquin-1 expression is increased 1 h after liver IR, and decreased at 6 and 12 h, 24 h restore (n = 6). Scale bars, 100 μm. (G) Immunofluorescence double-labeled Roquin-1 (green) and mø (red). Roquin-1 is primarily expressed in hepatic mø (n = 6). Scale bars, 50 μm. (H and I) Quantitative RT-PCR and WB in the mø suggest that Roquin-1 expression is increased 1 h after liver IR, and decreased at 6 and 12 h, 24 h after liver IR (n = 6). (J and K) The immunofluorescence double labeling and WB results showed that Roquin-1 in 1 h after liver IR was mainly expressed in CD11b+ mø. Scale bars, 50 μm. The data are expressed as the mean ± SD. *p < 0.01, **p < 0.01, ***p < 0.001, ****p < 0.0001.

