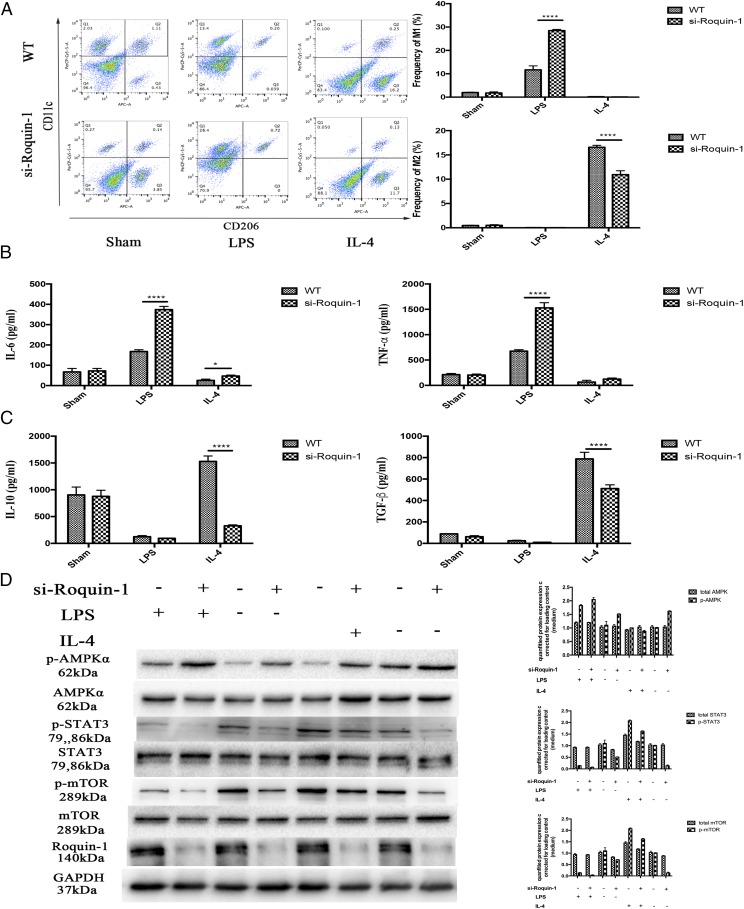
FIGURE 4.
The effect of Roquin-1 deficiency on M1/M2 polarization. (A) Flow cytometry analysis of M1/M2 polarization after LPS/IL-4 stimulation and/or Roquin-1 interference (n = 6). (B and C) ELISA analysis indicated that Roquin-1 interference promoted to M1 polarization and function, whereas it inhibited M2 polarization and function (6). (D) WB detects changes in signaling pathway proteins after LPS and IL-4 stimulation (n = 6). The data are expressed as the mean ± SD. *p < 0.01, **p < 0.01, ***p < 0.001, ****p < 0.0001.

