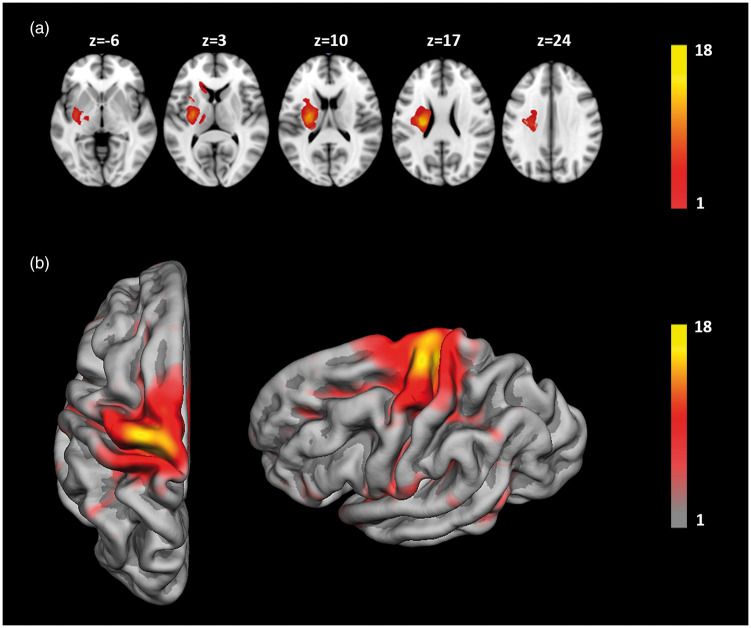
Figure 2.
(a) Overlay lesion plot of segmented stroke lesions of all patients (n = 18), z-coordinates correspond to the standard MNI152 brain template. (b) Surface map of cortical areas connected to subcortical stroke lesions. Overlay color indicates number of patients (see color bar). For illustrative purposes, all lesions were flipped to the left hemisphere.

