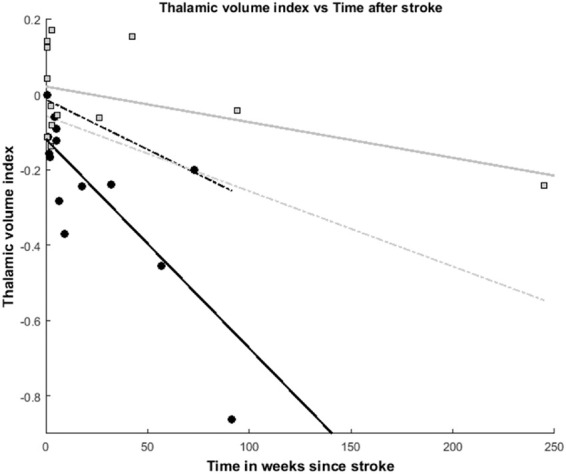
Figure 3.

Thalamic volume vs. time after stroke. Thalamic volume index vs. time after stroke. Data points from each subject with ipsilateral thalamic diaschisis are presented with black dots, whereas the group without ipsilateral thalamic diaschisis is shown as gray squares. The gray dotted line represents the lower 95% confidence interval of the ipsilateral thalamic diaschisis negative group. The black dotted line represents the upper 95% confidence interval of the ipsilateral thalamic diaschisis positive group. A strong correlation between a decrease in thalamic volume index (i.e. increased difference between ipsilateral and contralateral volumes) is shown for the subjects with ipsilateral thalamic diaschisis (black line; r2 = 0.60, p = 0.001). Such a correlation was not found for the subjects without ipsilateral thalamic diaschisis (gray line; r2=0.26, p = 0.07).
