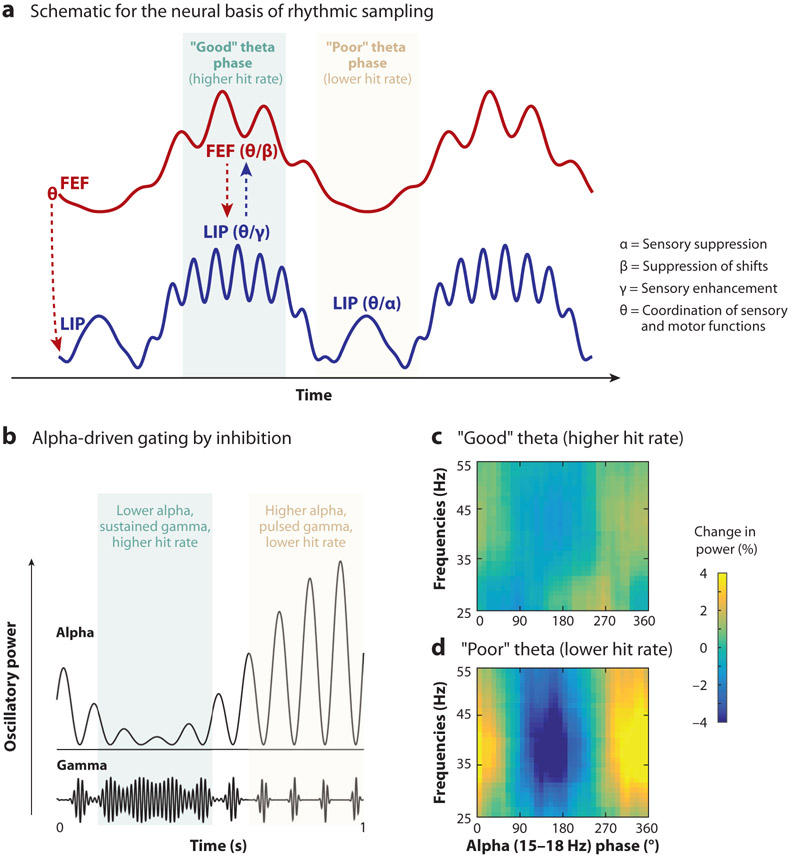
Figure 5.
Brain rhythms shape attention-related sampling. (a) Theta-band activity (3–8 Hz) in the attention network organizes neural activity into rhythmically alternating attentional states characterized by differences in temporal dynamics and behavioral performance. Periods of better behavioral performance (i.e., the “good” theta phase) are characterized by increases in both gamma- and beta-band activity (>35 Hz and 15–35 Hz), associated with sensory enhancement and the suppression of attentional shifts, respectively. Periods of worse behavioral performance (i.e., the “poor” theta phase) are characterized by increases in alpha-band activity (9–14 Hz), associated with sensory suppression. The arrows represent the directionality of frequency-specific activity (e.g., from FEF to LIP). Panel adapted with permission from Fiebelkorn et al. (2018). (b) Increases in alpha-band activity (e.g., observed during rhythmic periods of worse behavioral performance) are thought to gate visual processing by disrupting feedforward sensory signals. This disruption in visual processing can be observed as coupling between the phase of alpha-band activity and the power of gamma-band activity, with gamma-band activity being an established proxy for feedforward sensory processing. Panel adapted with permission from Osipova et al. (2008). (c,d) In the context of rhythmic sampling during spatial attention, there is evidence of alpha-driven gating in LIP during periods of worse behavioral performance. We have proposed that this rhythmically occurring, alpha-driven gating of visual sensory processing at an attended location is associated with an increased likelihood of attentional shifts. Panels adapted with permission from Fiebelkorn et al. (2019). Abbreviations: FEF, frontal eye fields; LIP, lateral intraparietal area.

