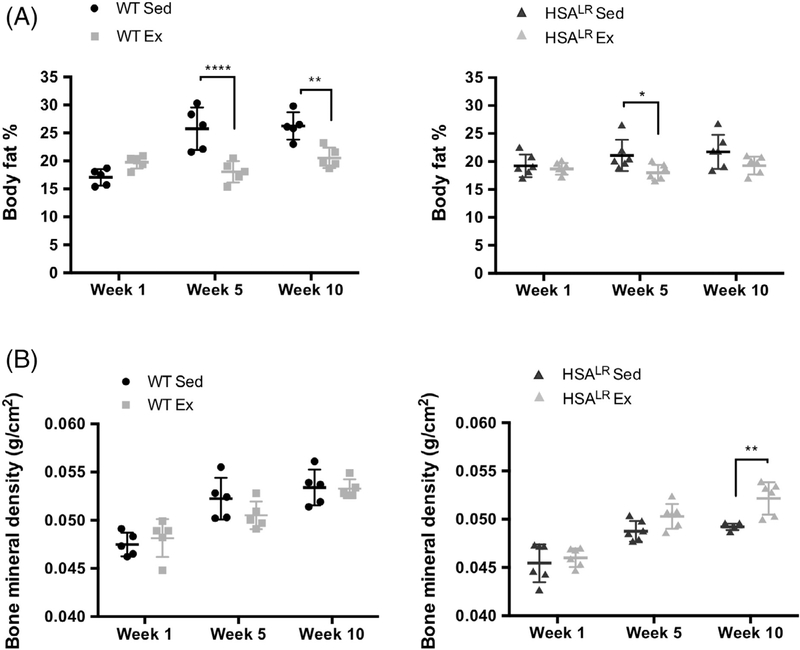
FIGURE 5.
Exercised animals display significant decreases in body fat in HSALR and WT animals. Body fat percentage (A) and bone mineral density (B) was measured at the start of the study (start of week 1), midway through (end of week 5), and at the conclusion of the training protocol (end of week 10). Individual data points displayed with mean ± SD. Statistical analysis was conducted with two-way ANOVA. Post-hoc analysis was performed using Tukey’s HSD correction. *P < .05, **P < .01, ****p < .0001

