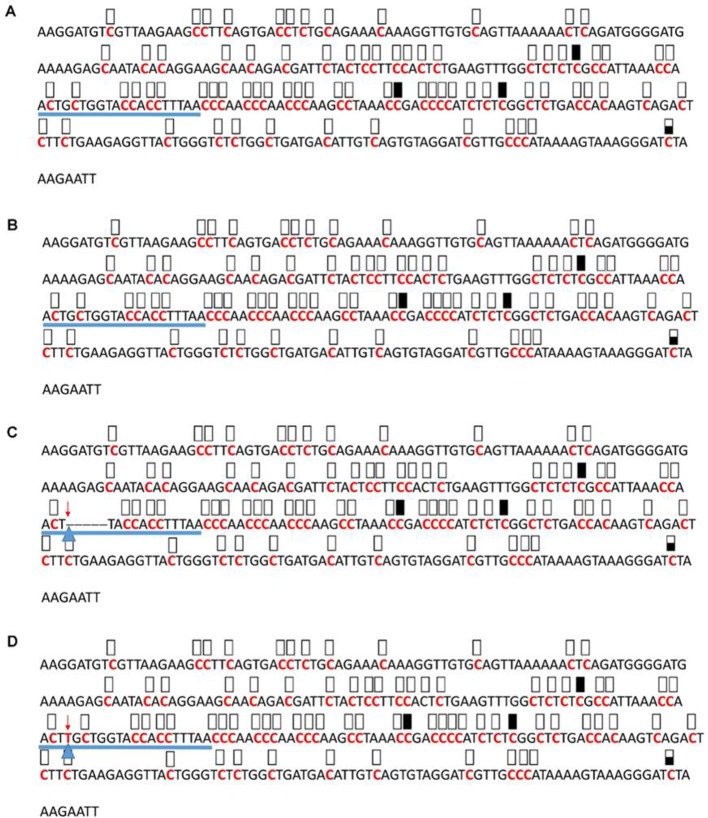
Figure 7.
Pattern of methylation of the AT3G17320 promoter in wild-type (A), transgenic empty vector (B), and transgenic edited (C, D) plants. Because the data were obtained by sequencing of independent pGEM-T colonies, an average level of methylation was determined for each cytosine. Solid boxes indicate that the cytosine at this position were methylated (>90%), open boxes indicate that cytosine methylation was not detected (<10%), and half-shaded boxes indicate that the cytosine was methylated at a range of 40-60%. Underlines indicate the 20-bp target sequences. The arrow and triangle in (C) indicate the five nucleotide “GCTGG” deletion. The arrow and triangle in (D) indicate the one nucleotide “T” addition. This figure presents results of 4 independent biological replicates.

