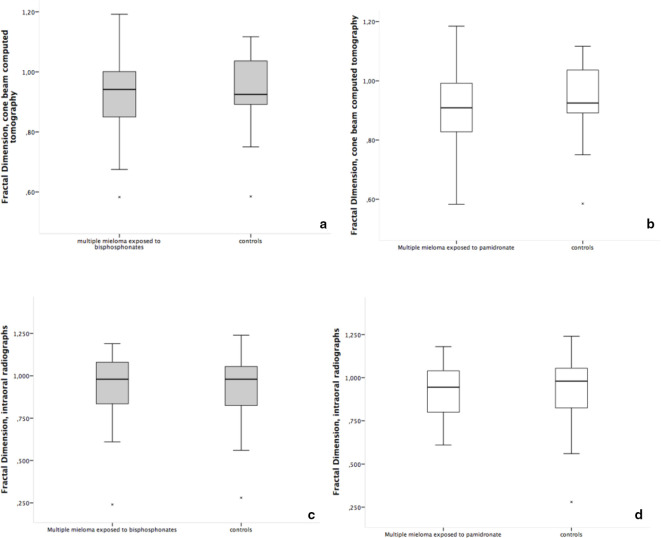
Figure 4.
Box-plot graphs of the fractal dimension (trabecular bone) measurement on cone beam computed tomography (a, b) and periapical intraoral radiograph (c, d). Figures a and c show individuals exposed to all types of bisphosphonates vs controls, and figures b and d show individuals exposed only to pamidronate vs controls.

