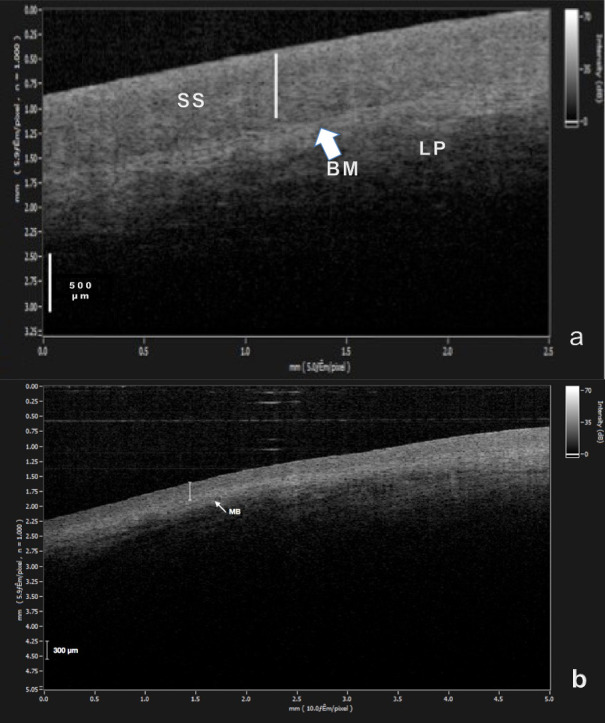
Figure 2.

OCT images of healthy mucosa. (a) Buccal mucosa OCT image shows the stratified SS along the mucosal surface, the underlying LP and the transition between these tissues along BM boundary. Vertical bar, 500 µm. (b) Gingival mucosa OCT image shows a weak contrast with its own lamina at a depth of about 260–300 µm. The lower contrast is typical of keratinized epithelium. Vertical bar, 300 µm. BM, basement membrane; OCT, opticalcoherence tomography; LP, lamina propria; SS, squamous epithelium.
